Copyright
©The Author(s) 2018.
World J Nephrol. Nov 24, 2018; 7(7): 129-142
Published online Nov 24, 2018. doi: 10.5527/wjn.v7.i7.129
Published online Nov 24, 2018. doi: 10.5527/wjn.v7.i7.129
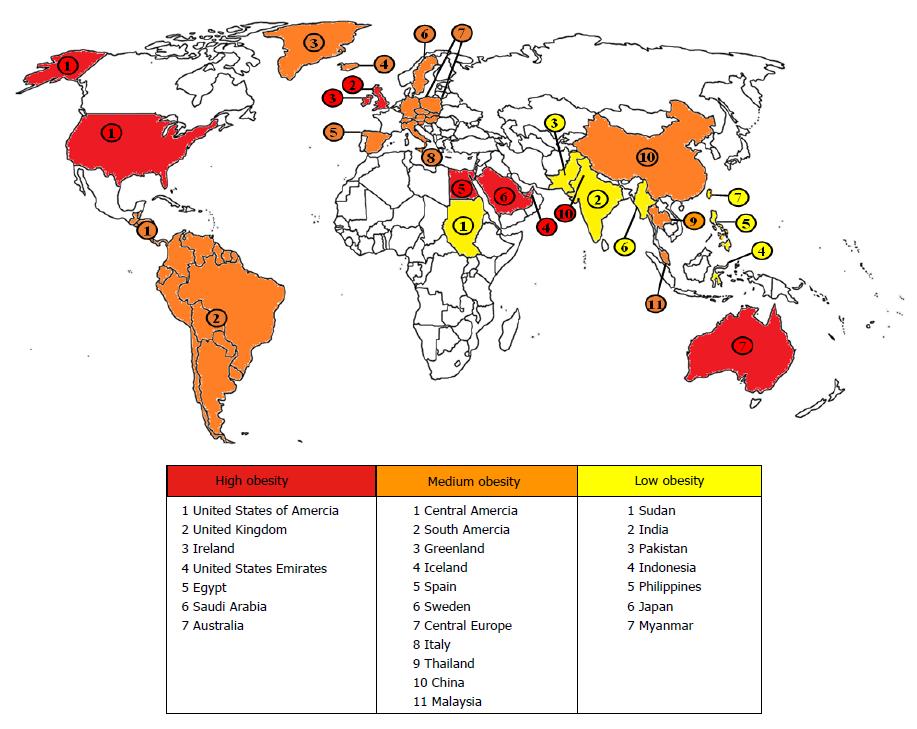
Figure 1 World map projection of obesity prevalence.
Red countries are countries with high prevalence of obesity; orange countries have an either a greater than 40% of obese population of obese + overweight population; and yellow countries have lower prevalence of obesity. Obesity defined as measurement of body mass index ≥ 30. Data retrieved from the Food and Agriculture Organization of the United Nations and the World Health Organization.
- Citation: Shin S, Srivastava A, Alli NA, Bandyopadhyay BC. Confounding risk factors and preventative measures driving nephrolithiasis global makeup. World J Nephrol 2018; 7(7): 129-142
- URL: https://www.wjgnet.com/2220-6124/full/v7/i7/129.htm
- DOI: https://dx.doi.org/10.5527/wjn.v7.i7.129


