
















Copyright: ©Author(s) 2026.
World J Nephrol. Jun 25, 2026; 15(2): 118363
Published online Jun 25, 2026. doi: 10.5527/wjn.v15.i2.118363
Published online Jun 25, 2026. doi: 10.5527/wjn.v15.i2.118363
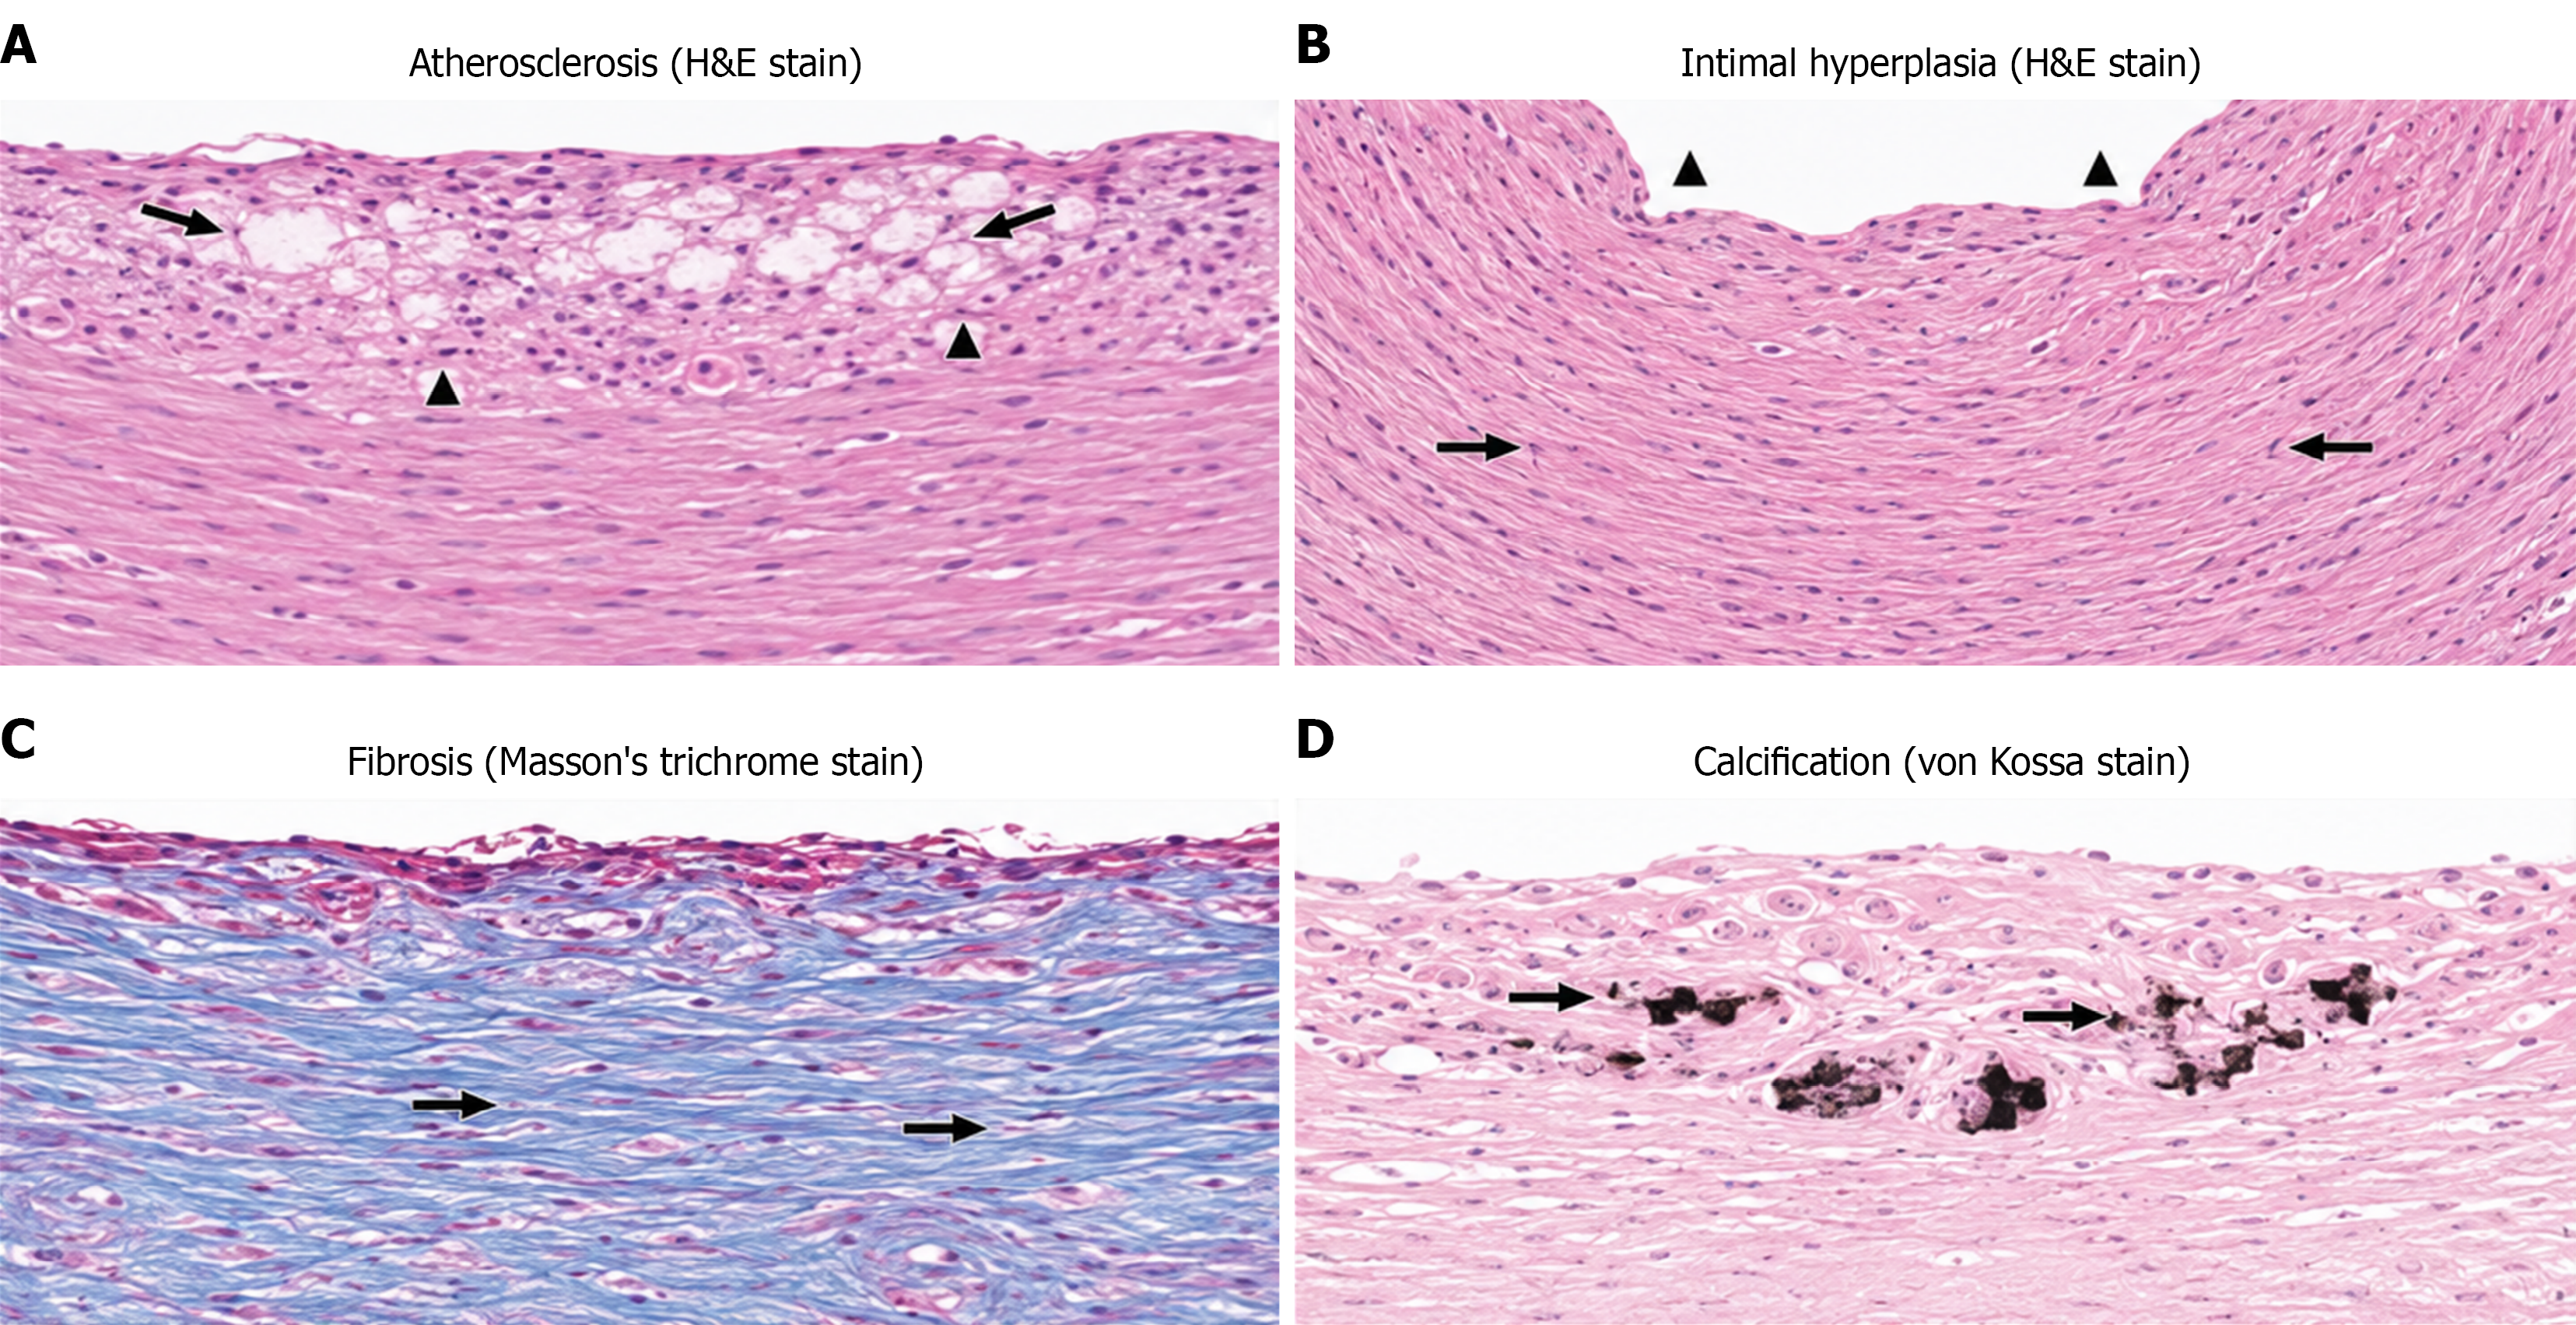
Figure 3 Representative histopathological images of vessel wall biopsy specimens.
Representative photomicrographs demonstrating major histopathological patterns observed in arterial and venous biopsy specimens. A: Atherosclerosis showing intimal lipid deposition with inflammatory cell infiltration (hematoxylin and eosin stain). Black arrows indicate lipid deposition within the intimal layer, while triangles indicate inflammatory cell infiltration; B: Intimal hyperplasia showing concentric smooth muscle cell proliferation and luminal narrowing (hematoxylin and eosin stain). Black arrows indicate smooth muscle cell proliferation and triangles indicate luminal narrowing due to intimal hyperplasia; C: Fibrosis highlighted by collagen deposition (Masson’s trichrome stain). Black arrows indicate collagen deposition within the vessel wall highlighted by Masson’s trichrome staining; D: Calcification demonstrating calcium deposition within the vessel wall (von Kossa stain). Black arrows indicate areas of calcium deposition within the vascular wall demonstrated by von Kossa staining.
- Citation: Gupta S, Hegde AV, Shetty S, Michael SN, Adiga K P. Can preoperative parameters and histopathology of the vessels affect arteriovenous fistula outcomes? A prospective observational study. World J Nephrol 2026; 15(2): 118363
- URL: https://www.wjgnet.com/2220-6124/full/v15/i2/118363.htm
- DOI: https://dx.doi.org/10.5527/wjn.v15.i2.118363