
















Copyright: ©Author(s) 2026.
World J Nephrol. Jun 25, 2026; 15(2): 118343
Published online Jun 25, 2026. doi: 10.5527/wjn.v15.i2.118343
Published online Jun 25, 2026. doi: 10.5527/wjn.v15.i2.118343
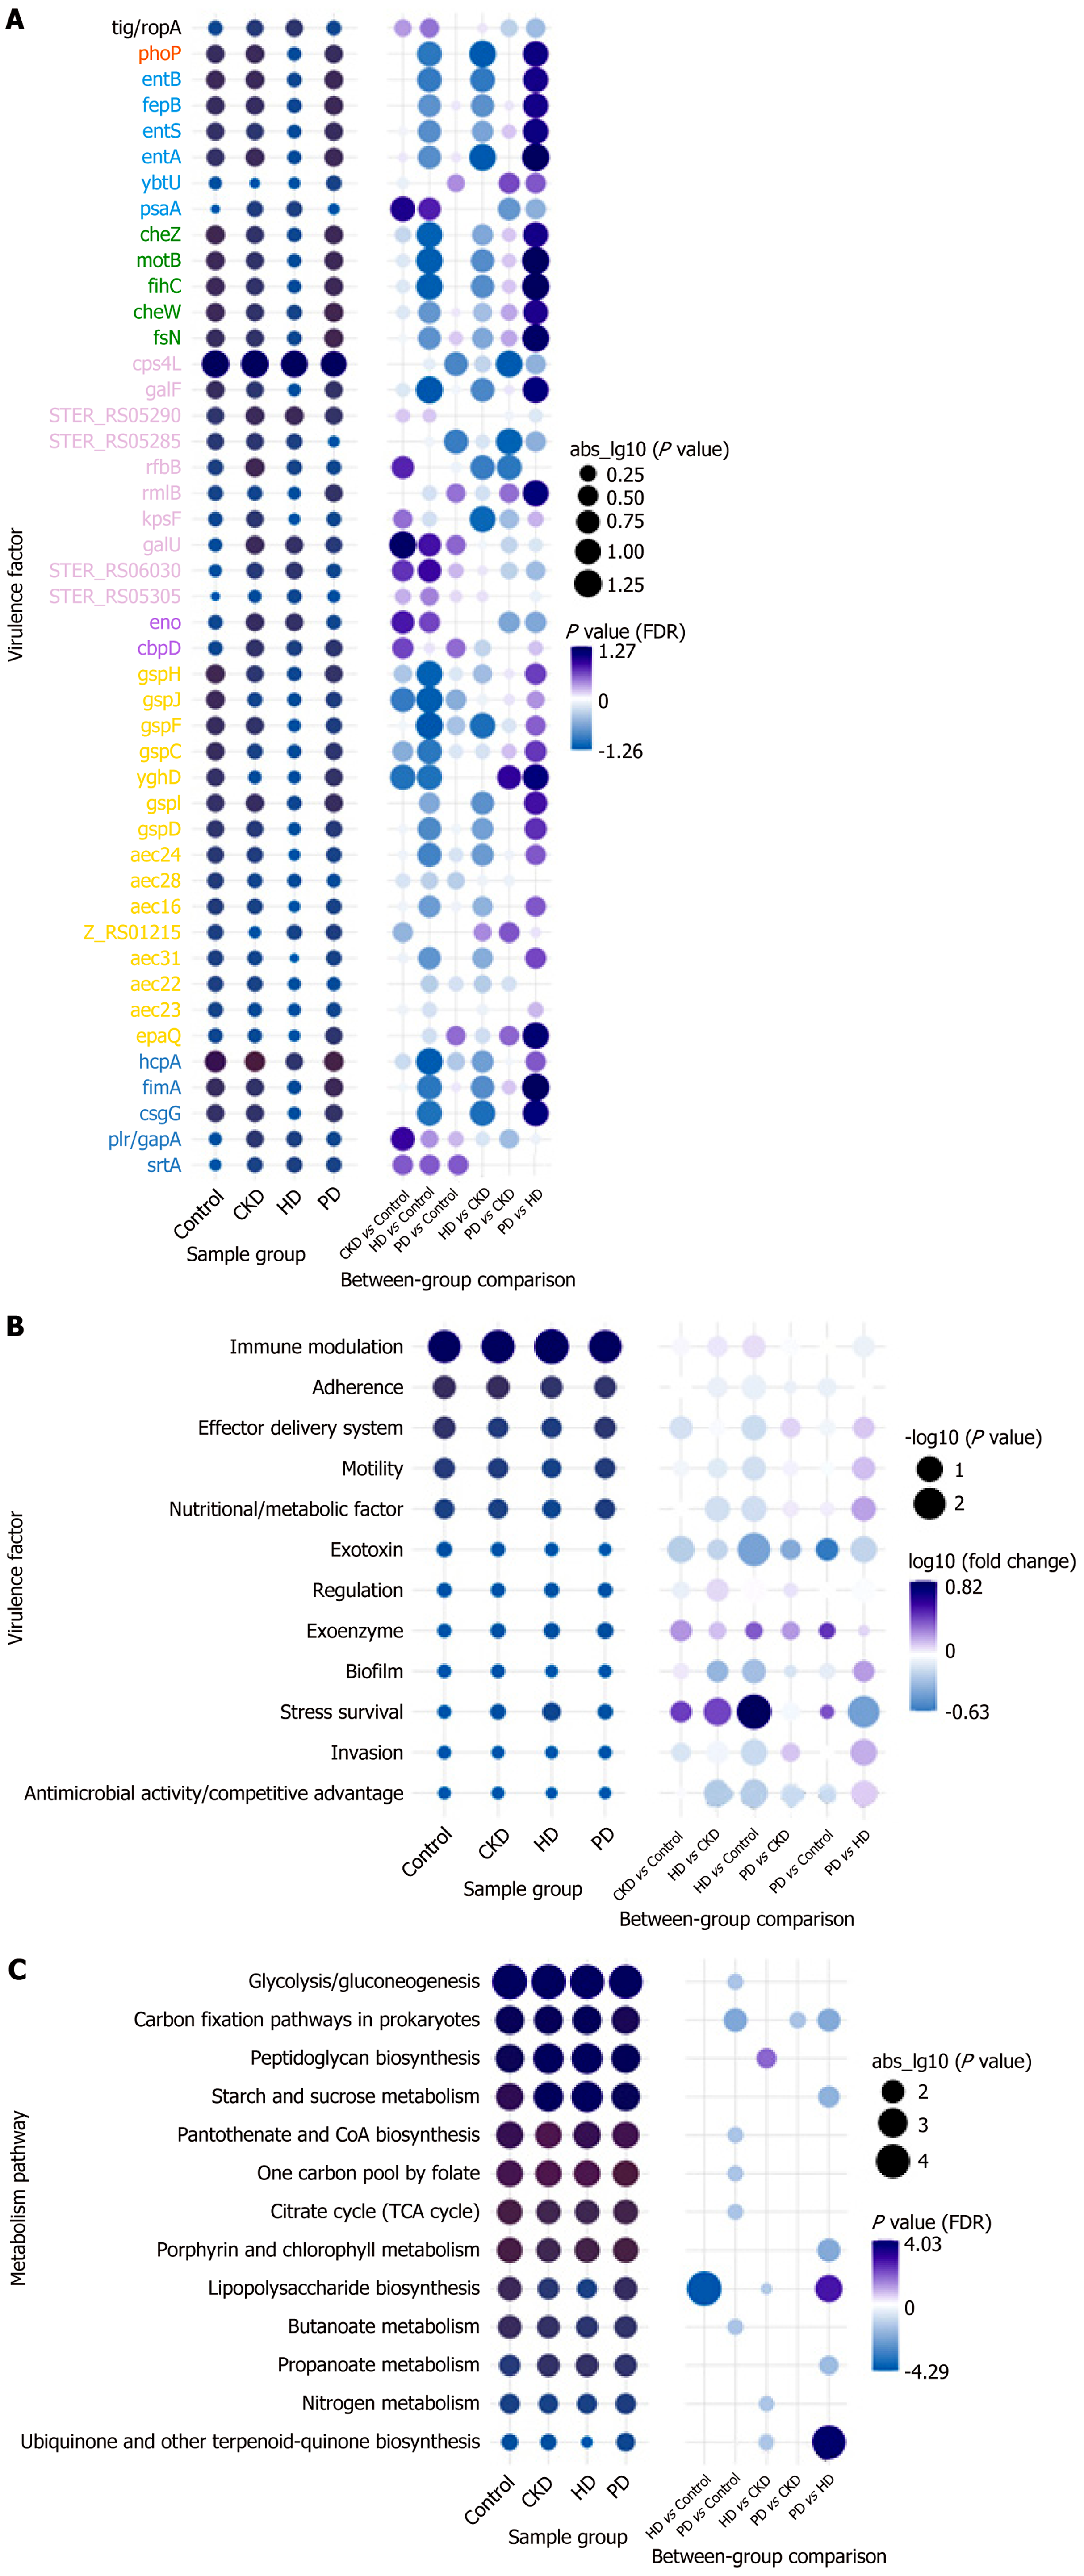
Figure 5 Cross-group virulence and metabolic architectures in chronic kidney disease.
A: Thirty most prevalent virulence factors (VFs) across sample groups. Each row represents a VF (gene or gene cluster associated with pathogenicity). The first four columns show prevalence within each group (control, chronic kidney disease, hemodialysis, peritoneal dialysis); bubble size and color indicate prevalence/abundance. The six columns on the right display pairwise group comparisons (Fisher’s exact test); red and blue bubbles denote VFs significantly increased or decreased, respectively, in the row group relative to the column group (adjusted P value); B: VF categories across groups. Bubble plot summarizing major VF functional classes (for example, immune modulation, adherence, motility, invasion, biofilm, stress survival). Left columns show category prevalence in each group (bubble size proportional to prevalence; color indicating magnitude); right columns show pairwise comparisons with bubble color indicating direction (purple = higher, blue = lower) and bubble size reflecting -log10 (P value) (adjusted for multiple testing); C: Metabolic pathway architectures across groups. Bubble plot of metagenomically predicted metabolic pathways (for example, glyco
- Citation: Almuhanna AA, Vatte C, Guo Q, Elsalamouni TS, Al-Muhanna FA, Aboalrihy AM, Alhabib HA, Almomen MF, Alali RA, Habara AH, Alrubaish MA, Alfalah KM, Cyrus C, Abdul-Rahman IS, Keating BJ, Al-Ali AK, Wang C. Gut microbiota in a Saudi population with chronic kidney disease. World J Nephrol 2026; 15(2): 118343
- URL: https://www.wjgnet.com/2220-6124/full/v15/i2/118343.htm
- DOI: https://dx.doi.org/10.5527/wjn.v15.i2.118343