
















Copyright: ©Author(s) 2026.
World J Nephrol. Jun 25, 2026; 15(2): 118343
Published online Jun 25, 2026. doi: 10.5527/wjn.v15.i2.118343
Published online Jun 25, 2026. doi: 10.5527/wjn.v15.i2.118343
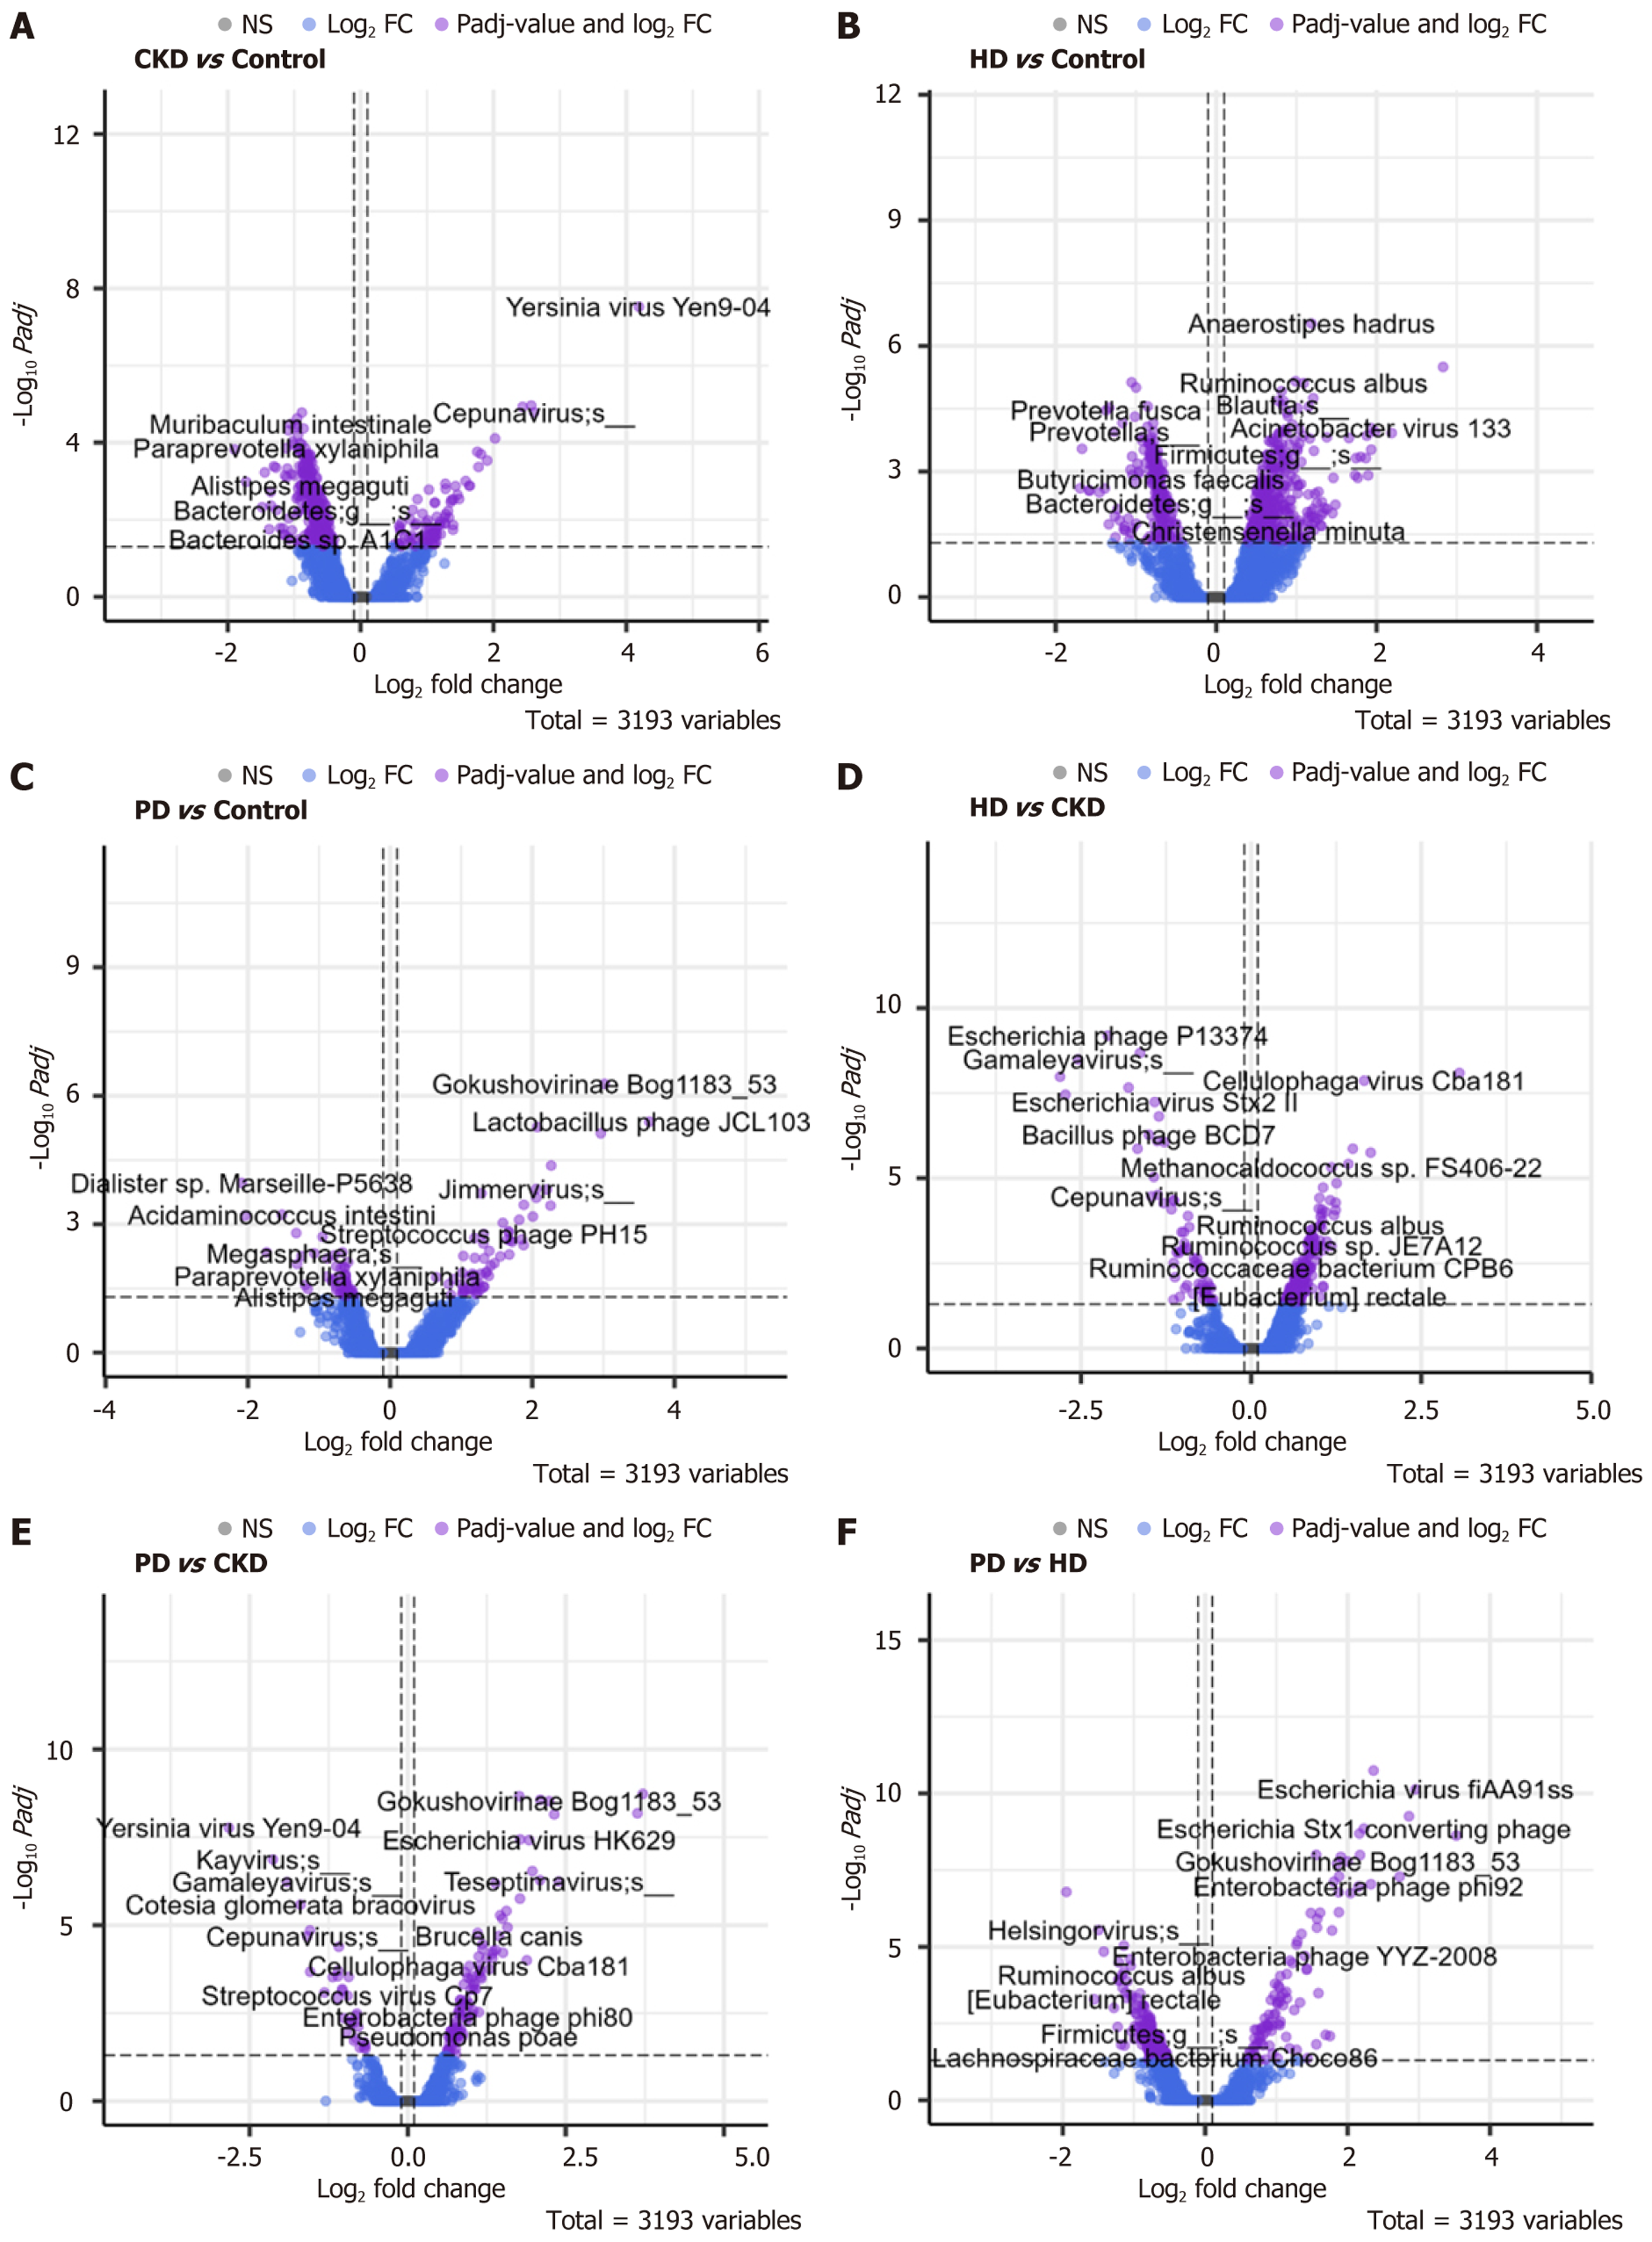
Figure 3 Differential viral taxa abundance across chronic kidney disease groups.
Volcano plots show differential abundance of viral taxa (n = 3193) for six pairwise comparisons; each point is a viral taxon, the X-axis is log2 fold change and the Y-axis is -log10 adjusted P value. Horizontal and vertical dashed lines indicate the thresholds used for significance (adjusted P value and minimum log2 fold change). Color indicates significance: Blue: Non-significant, purple: Significant by fold change only. A: Chronic kidney disease (CKD) vs Control, viral taxa enriched or depleted in conservatively managed CKD patients compared with healthy controls; selected highly significant taxa are labelled on the plot; B: Hemodialysis (HD) vs control, viral taxa enriched or depleted in hemodialysis patients compared with healthy controls; C: Peritoneal dialysis (PD) vs control, viral taxa enriched or depleted in peritoneal dialysis patients compared with healthy controls; D: HD vs CKD, viral taxa differing between hemodialysis and conservatively managed CKD patients (highlights dialysis-associated shifts); E: PD vs CKD, viral taxa differing between peritoneal dialysis and conservatively managed CKD patients; F: PD vs HD, viral taxa differing between peritoneal dialysis and hemodialysis patients (directionality shown by sign of log2 fold change). CKD: Chronic kidney disease; HD: Hemodialysis; PD: Peritoneal dialysis.
- Citation: Almuhanna AA, Vatte C, Guo Q, Elsalamouni TS, Al-Muhanna FA, Aboalrihy AM, Alhabib HA, Almomen MF, Alali RA, Habara AH, Alrubaish MA, Alfalah KM, Cyrus C, Abdul-Rahman IS, Keating BJ, Al-Ali AK, Wang C. Gut microbiota in a Saudi population with chronic kidney disease. World J Nephrol 2026; 15(2): 118343
- URL: https://www.wjgnet.com/2220-6124/full/v15/i2/118343.htm
- DOI: https://dx.doi.org/10.5527/wjn.v15.i2.118343