
















Copyright: ©Author(s) 2026.
World J Nephrol. Jun 25, 2026; 15(2): 118343
Published online Jun 25, 2026. doi: 10.5527/wjn.v15.i2.118343
Published online Jun 25, 2026. doi: 10.5527/wjn.v15.i2.118343
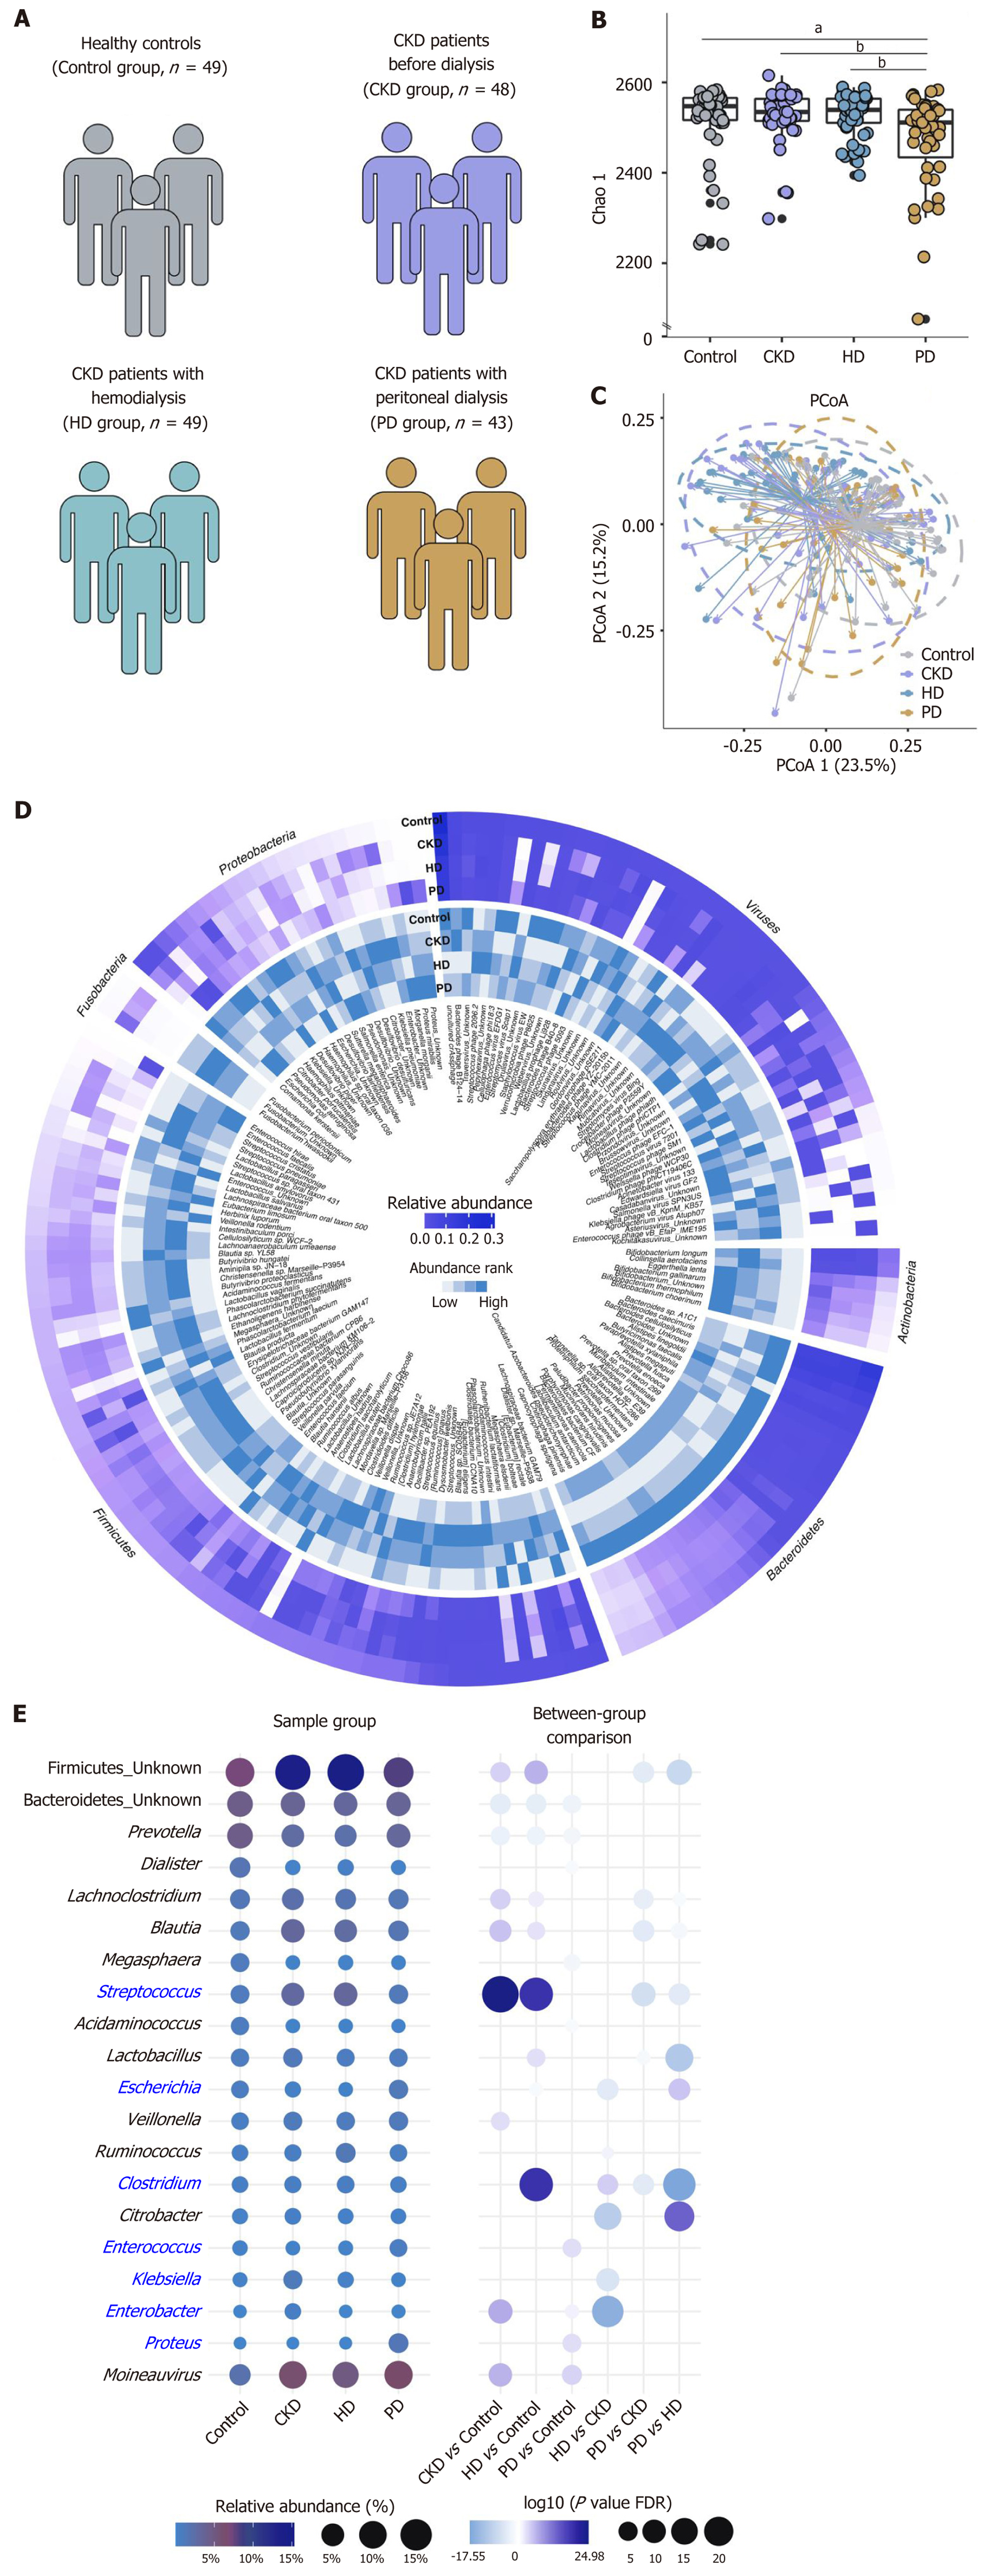
Figure 2 Study design and taxonomic architectures.
A: Sample group setting of the study; B: Species richness (Chao 1) across sample groups. The peritoneal dialysis group had the lowest species richness among all the groups (Wilcoxon test, aP < 0.05, bP < 0.01). Lower species richness is often associated with disease and is generally thought to lead to decreased resilience; C: Principal coordinate analysis of the species abundance matrix showing deviations in the microbial compositions among the four sample groups; D: Microbial species compositions of the microbial community across groups (top 50 species in each sample group); E: Bubble plot showing differentially abundant key bacterial genera across control, chronic kidney disease, hemodialysis, and peritoneal dialysis groups. Bubble size represents relative abundance (%), and bubble color represents the log10 (false discovery rate-adjusted P value) for group differences. The accompanying comparison panel summarizes pairwise between-group differences, with color indicating the direction of change between the indicated groups. CKD: Chronic kidney disease; PD: Peritoneal dialysis; HD: Hemodialysis.
- Citation: Almuhanna AA, Vatte C, Guo Q, Elsalamouni TS, Al-Muhanna FA, Aboalrihy AM, Alhabib HA, Almomen MF, Alali RA, Habara AH, Alrubaish MA, Alfalah KM, Cyrus C, Abdul-Rahman IS, Keating BJ, Al-Ali AK, Wang C. Gut microbiota in a Saudi population with chronic kidney disease. World J Nephrol 2026; 15(2): 118343
- URL: https://www.wjgnet.com/2220-6124/full/v15/i2/118343.htm
- DOI: https://dx.doi.org/10.5527/wjn.v15.i2.118343