
















Copyright: ©Author(s) 2026.
World J Nephrol. Jun 25, 2026; 15(2): 117721
Published online Jun 25, 2026. doi: 10.5527/wjn.v15.i2.117721
Published online Jun 25, 2026. doi: 10.5527/wjn.v15.i2.117721
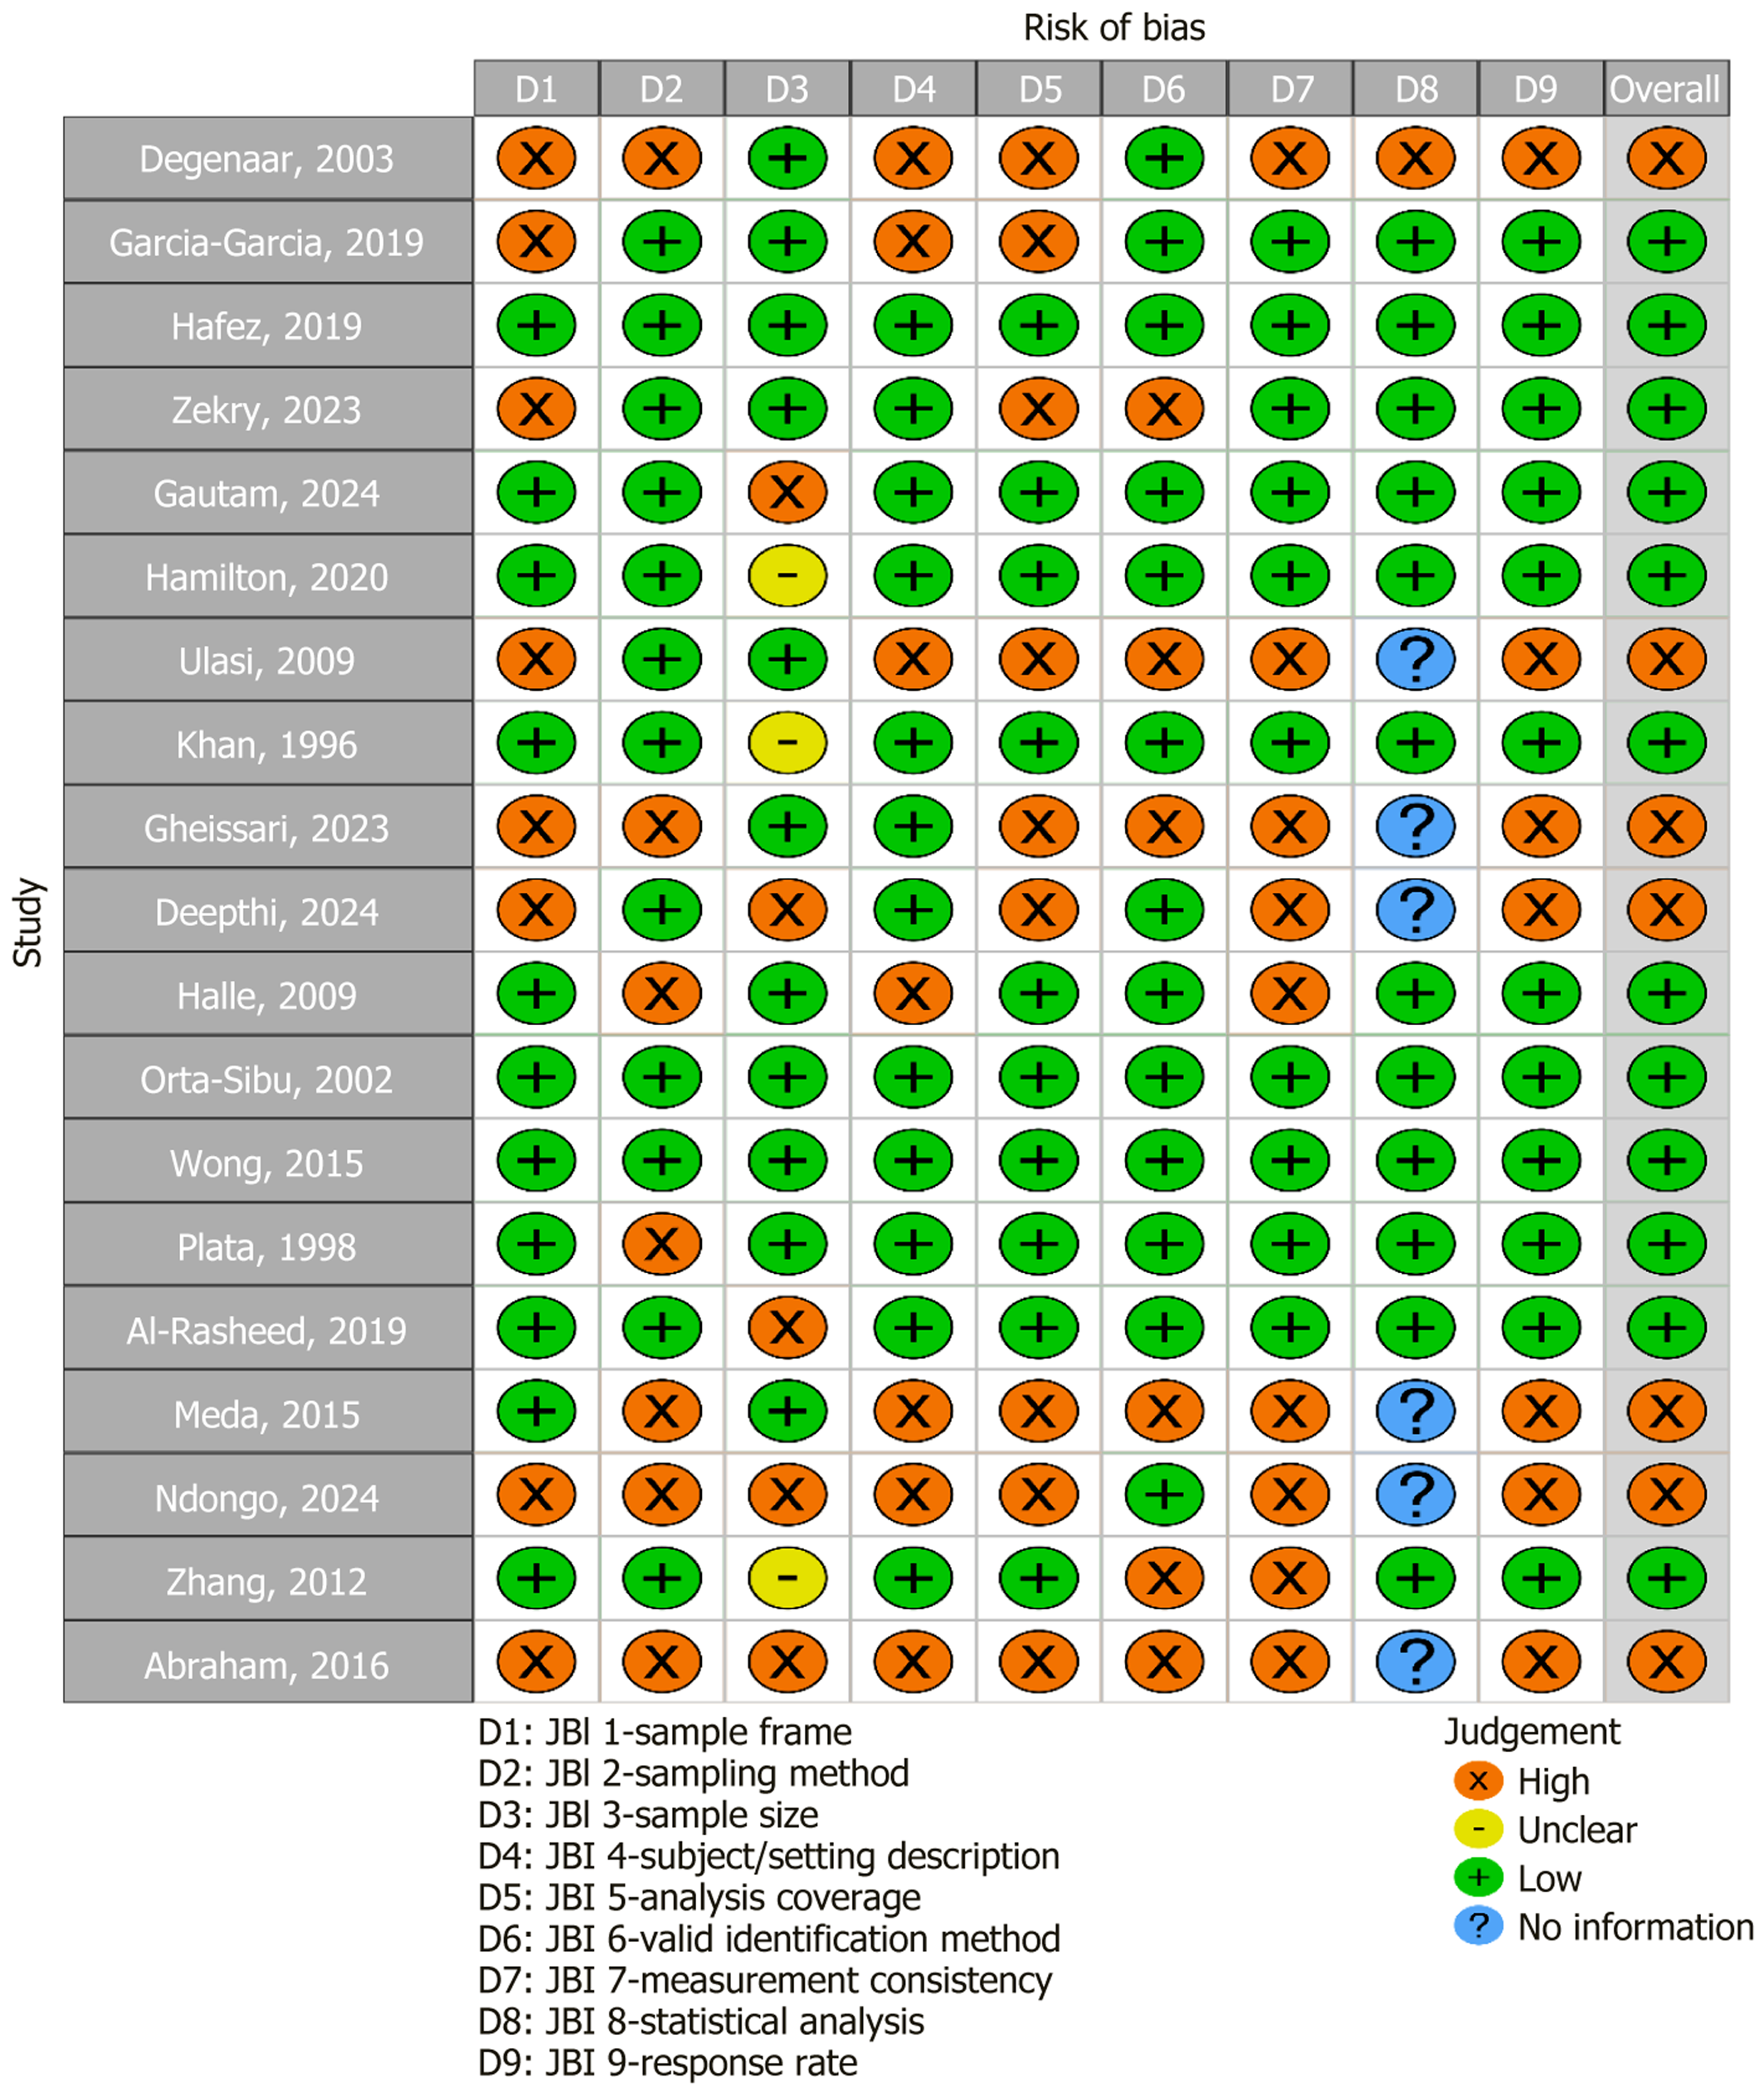
Figure 7 Traffic-light plot of risk-of-bias assessment for included prevalence studies.
Each row represents a study and each column one of the nine Joanna Briggs Institute prevalence domains (D1-D9), with green circles indicating low risk of bias, yellow unclear risk, orange high risk, and blue indicating no information. The right-hand column summarizes the overall judgement for each study.
- Citation: Tommy A, Soldera J. Epidemiology of chronic kidney disease in young patients in developing countries. World J Nephrol 2026; 15(2): 117721
- URL: https://www.wjgnet.com/2220-6124/full/v15/i2/117721.htm
- DOI: https://dx.doi.org/10.5527/wjn.v15.i2.117721