
















Copyright: ©Author(s) 2026.
World J Nephrol. Jun 25, 2026; 15(2): 117721
Published online Jun 25, 2026. doi: 10.5527/wjn.v15.i2.117721
Published online Jun 25, 2026. doi: 10.5527/wjn.v15.i2.117721
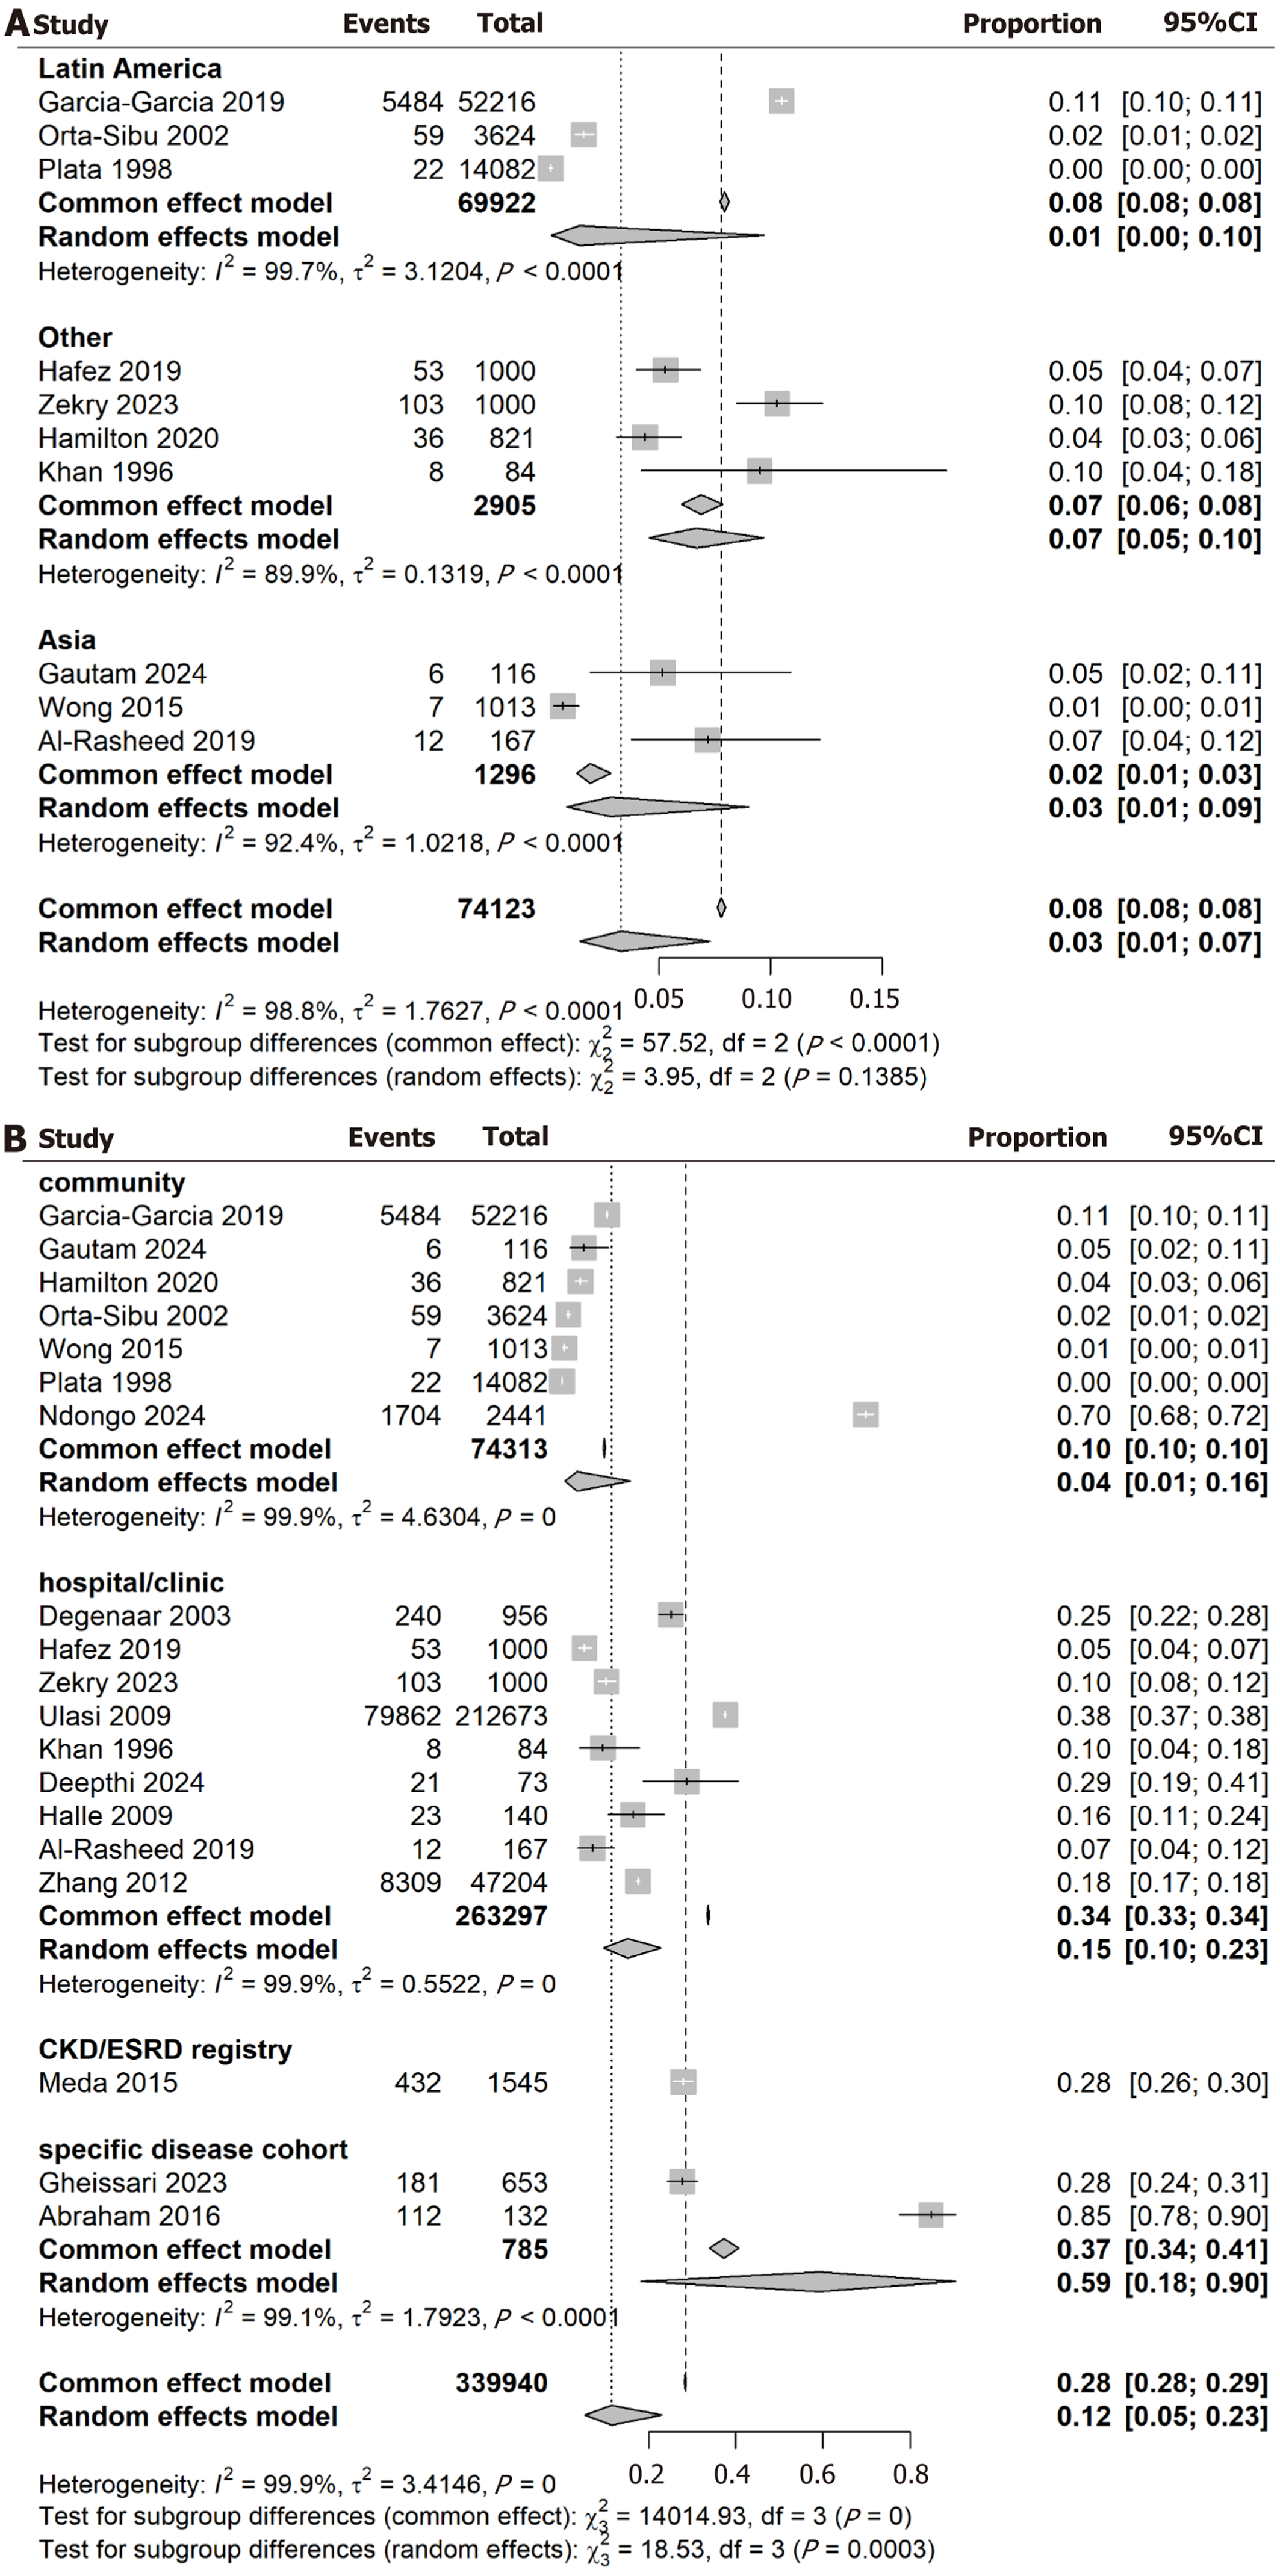
Figure 6 Forest plot of chronic kidney disease in young people.
A: Forest plot of chronic kidney disease (CKD) prevalence in young people stratified by world region after further restriction to studies with prevalence ≤ 0.16. Regional pooled estimates and overall pooled prevalence (common-effect and random-effects) with 95% confidence intervals are shown, illustrating that substantial heterogeneity remains despite exclusion of the highest-prevalence studies; B: Forest plot of CKD prevalence in young people (≤ 25 years) by study setting in low- and middle-income countries. Studies are grouped as community-based, hospital/clinic-based, CKD/end-stage renal disease registries, and specific disease cohorts. Squares represent individual study estimates (size proportional to study weight), horizontal lines indicate 95% confidence intervals, and diamonds show pooled prevalence for each setting and overall, obtained from random-effects generalized linear mixed models (logit transformation). CI: Confidence interval.
- Citation: Tommy A, Soldera J. Epidemiology of chronic kidney disease in young patients in developing countries. World J Nephrol 2026; 15(2): 117721
- URL: https://www.wjgnet.com/2220-6124/full/v15/i2/117721.htm
- DOI: https://dx.doi.org/10.5527/wjn.v15.i2.117721