
















Copyright: ©Author(s) 2026.
World J Nephrol. Jun 25, 2026; 15(2): 117721
Published online Jun 25, 2026. doi: 10.5527/wjn.v15.i2.117721
Published online Jun 25, 2026. doi: 10.5527/wjn.v15.i2.117721
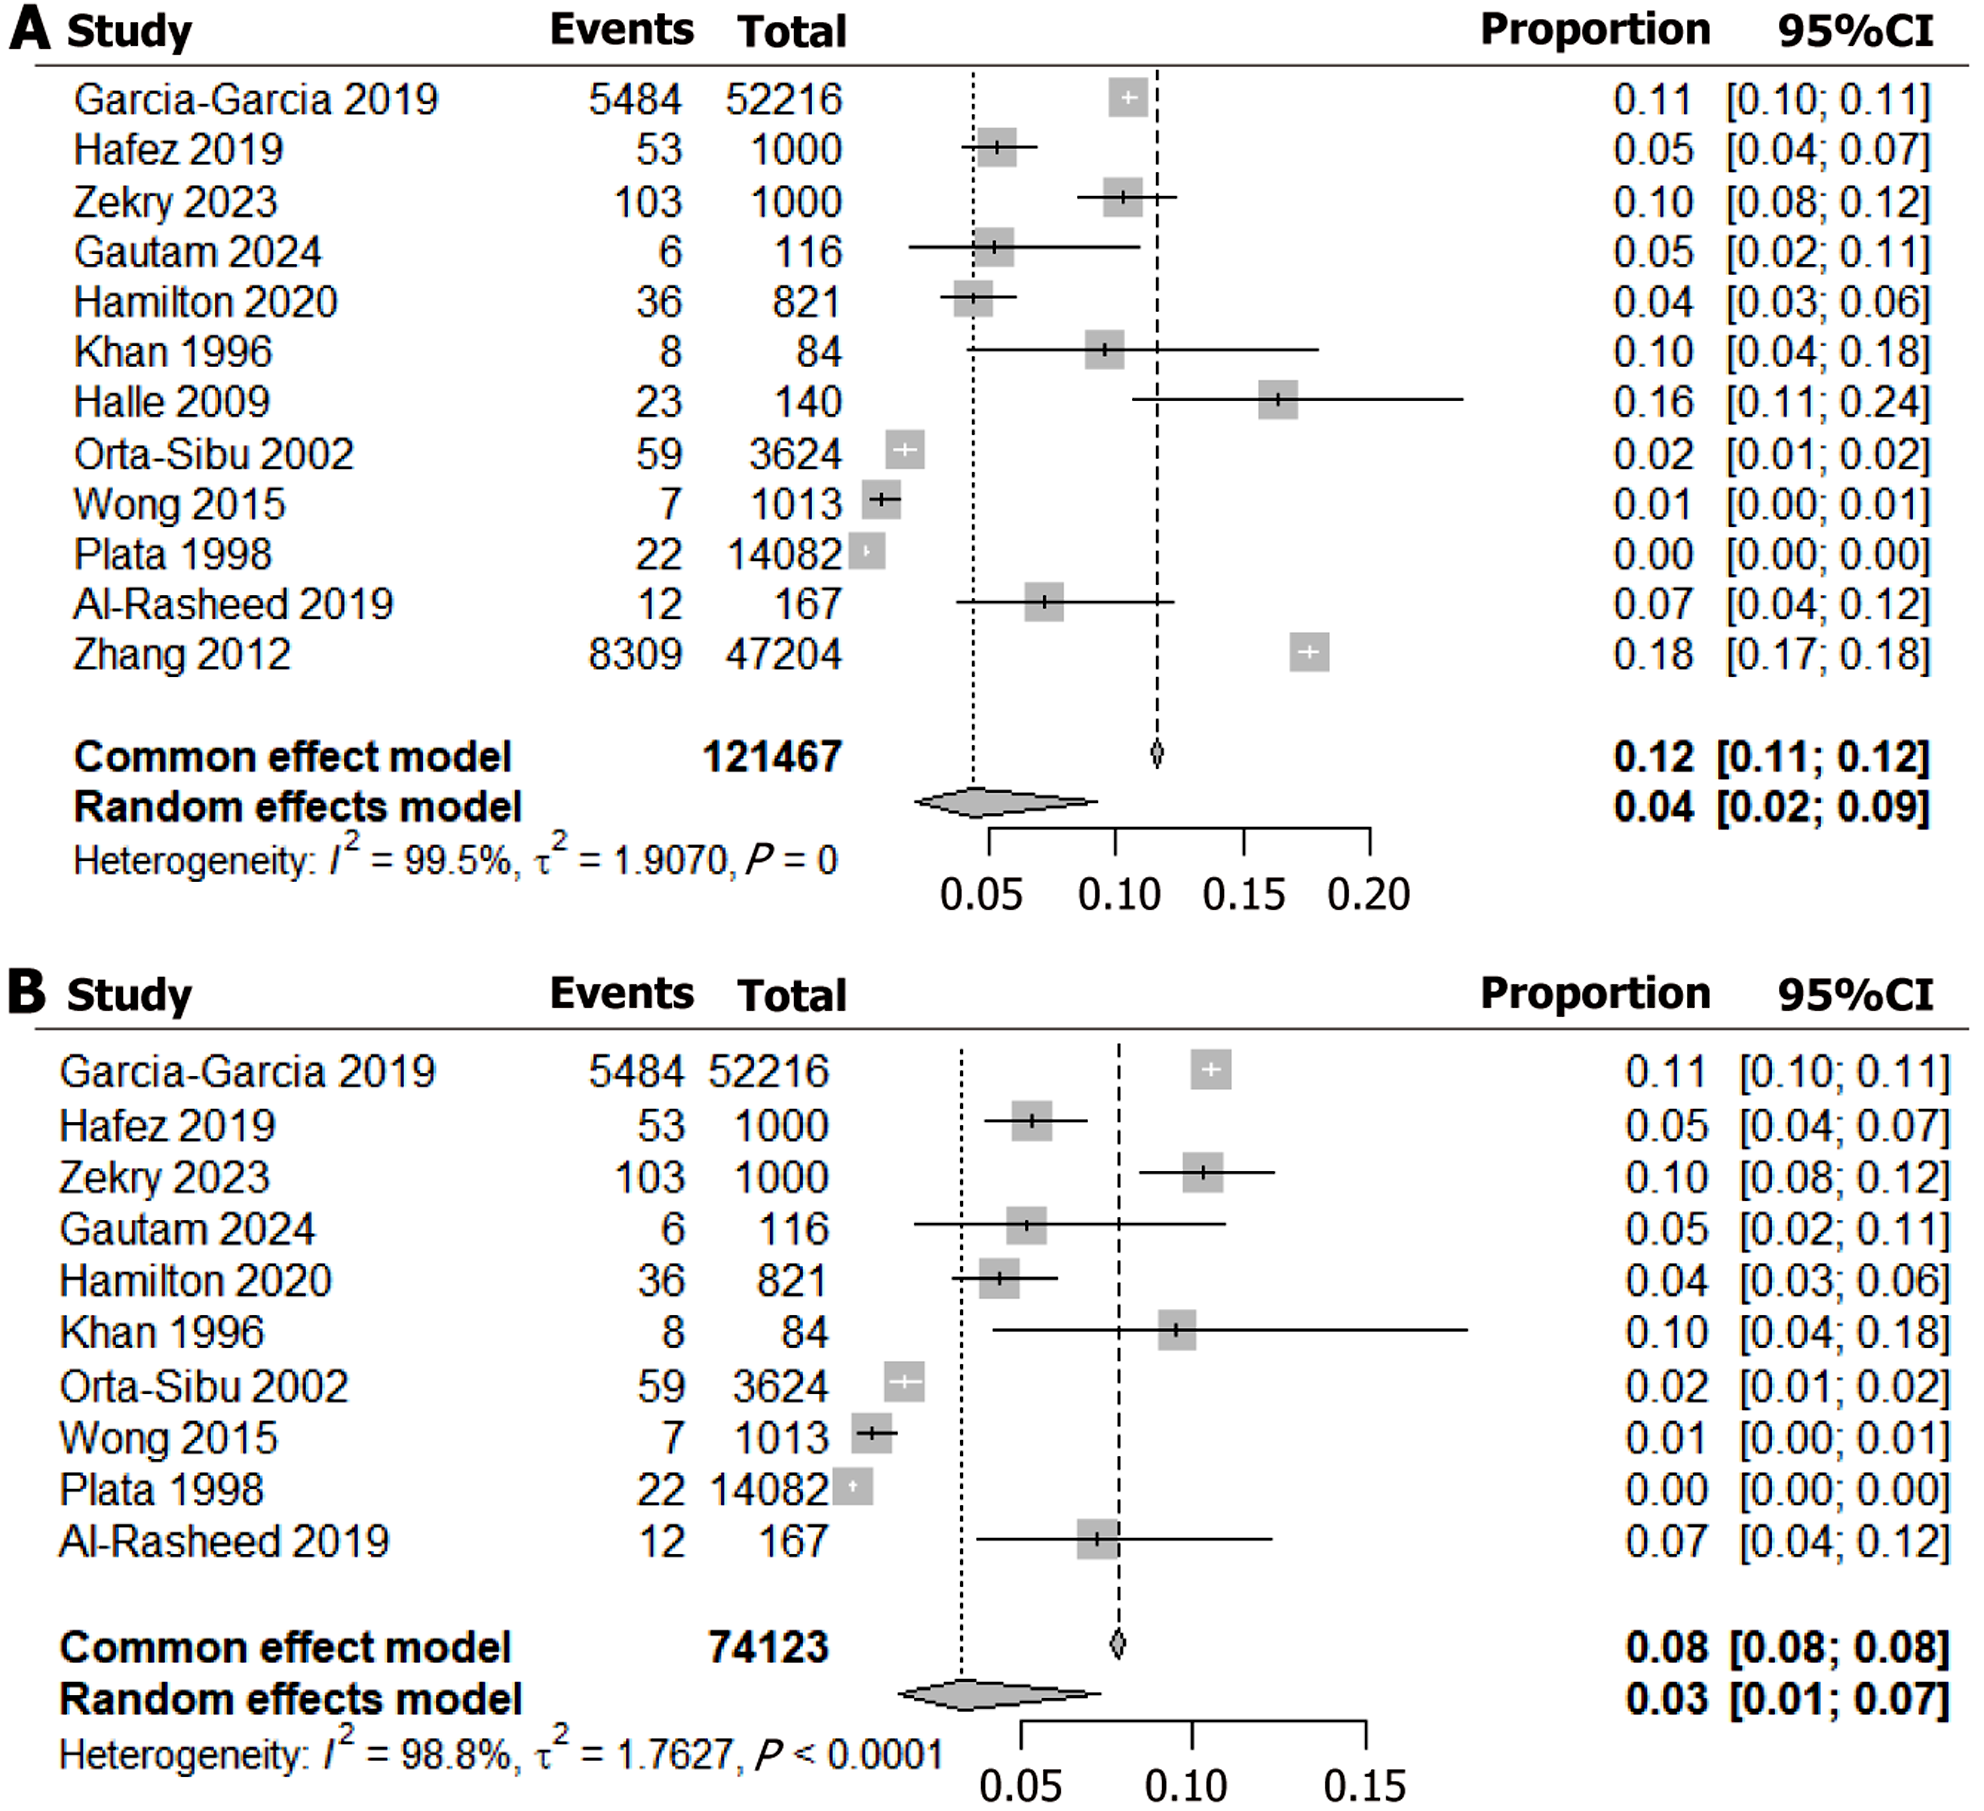
Figure 4 Sensitivity analysis forest plot.
A: Sensitivity analysis forest plot of chronic kidney disease prevalence restricted to 12 studies with prevalence ≤ 0.20, excluding the highest-risk clinical and registry cohorts; study-specific estimates and pooled common- and random-effects prevalences are shown, with heterogeneity statistics reported below; B: Further sensitivity analysis forest plot of chronic kidney disease prevalence restricted to 10 studies with prevalence ≤ 0.16, approximating more general young populations; individual study proportions, pooled estimates and residual between-study heterogeneity from the generalized linear mixed model are displayed. CI: Confidence interval.
- Citation: Tommy A, Soldera J. Epidemiology of chronic kidney disease in young patients in developing countries. World J Nephrol 2026; 15(2): 117721
- URL: https://www.wjgnet.com/2220-6124/full/v15/i2/117721.htm
- DOI: https://dx.doi.org/10.5527/wjn.v15.i2.117721