
















Copyright: ©Author(s) 2026.
World J Nephrol. Jun 25, 2026; 15(2): 117721
Published online Jun 25, 2026. doi: 10.5527/wjn.v15.i2.117721
Published online Jun 25, 2026. doi: 10.5527/wjn.v15.i2.117721
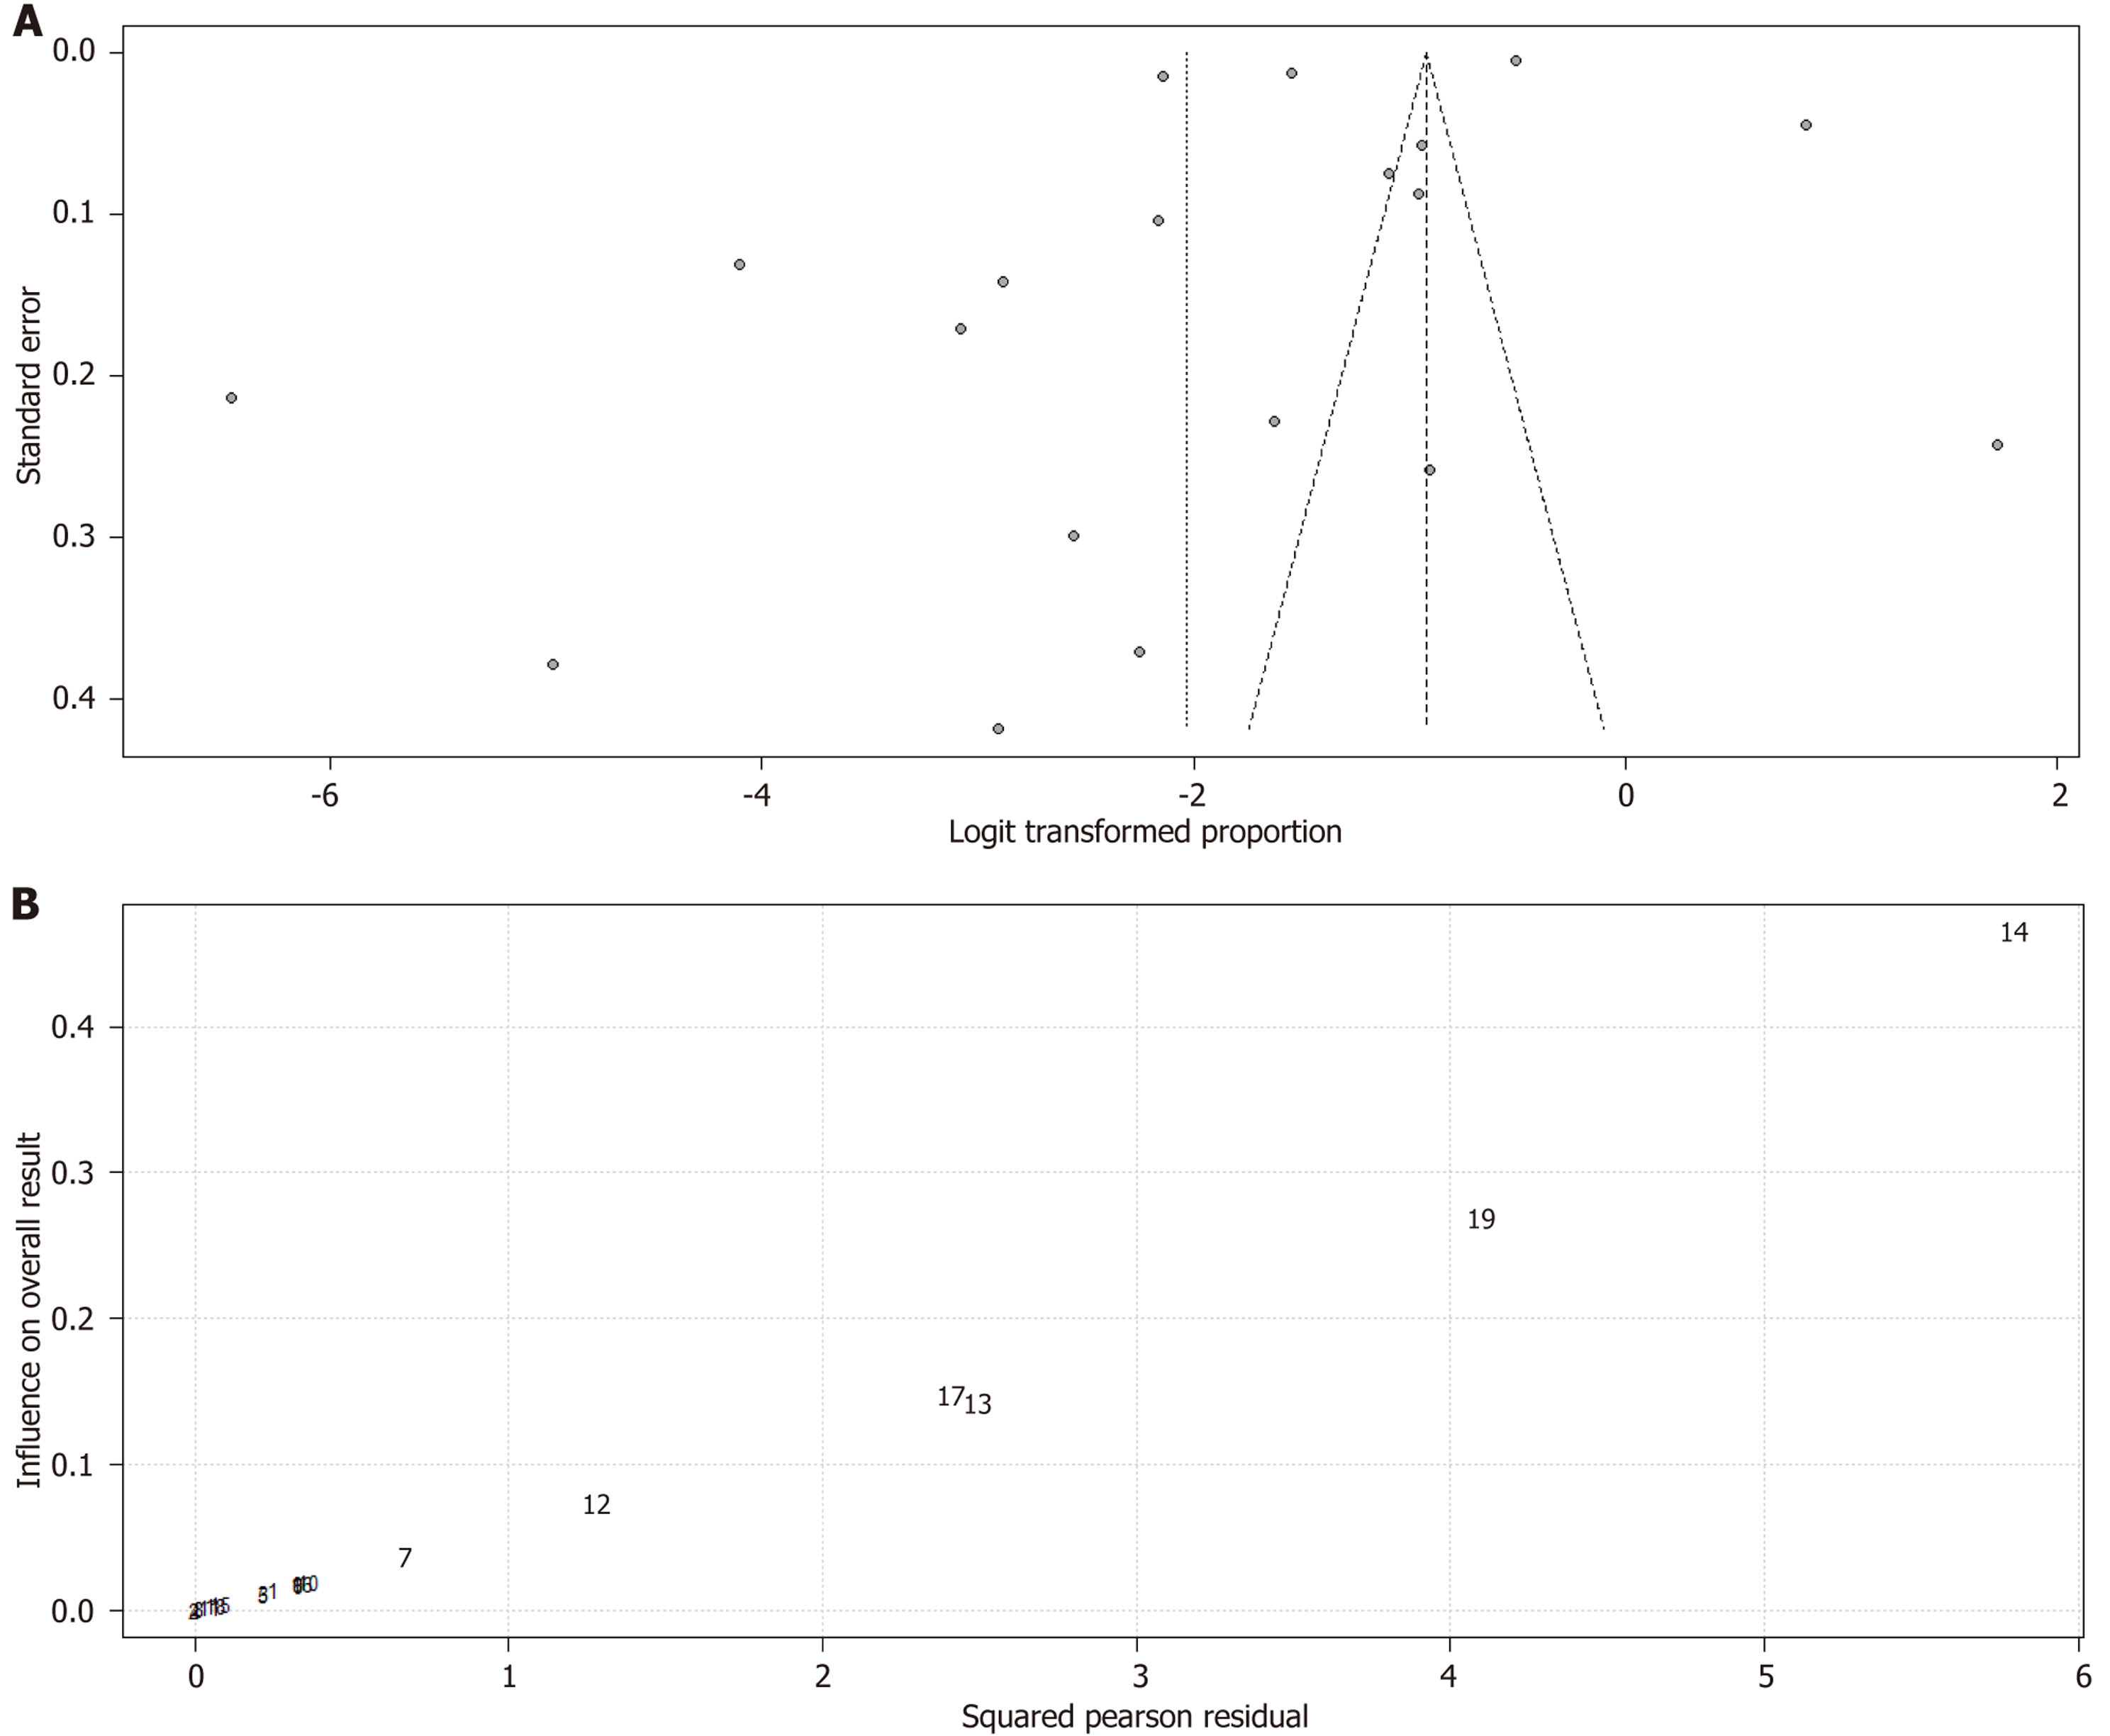
Figure 3 Funnel plot and generalized linear mixed model meta-analysis of chronic kidney disease.
A: Funnel plot of logit-transformed chronic kidney disease (CKD) prevalence with pseudo 95% confidence limits. Funnel plot displaying the standard error (Y-axis) against the logit-transformed prevalence estimates from each study (X-axis) under the random-intercept logistic regression model. The vertical dotted line represents the pooled logit prevalence, and the dashed lines indicate pseudo 95% confidence limits. The observed asymmetry reflects the marked between-study heterogeneity and suggests potential small-study or setting-related effects rather than a simple pattern of publication bias; B: Influence diagnostics for the generalized linear mixed model meta-analysis of CKD prevalence in young people in low- and middle-income countries. Influence plot showing each included study (labelled by study ID) according to its squared Pearson residual (X-axis) and its influence on the pooled prevalence estimate (Y-axis), under the random-intercept logistic regression model. Studies in the upper-right quadrant (notably studies 14 and 19) have both large residuals and greater influence on the overall result, indicating potentially influential outliers that contribute disproportionately to the observed heterogeneity.
- Citation: Tommy A, Soldera J. Epidemiology of chronic kidney disease in young patients in developing countries. World J Nephrol 2026; 15(2): 117721
- URL: https://www.wjgnet.com/2220-6124/full/v15/i2/117721.htm
- DOI: https://dx.doi.org/10.5527/wjn.v15.i2.117721