
















©The Author(s) 2025.
World J Nephrol. Dec 25, 2025; 14(4): 112066
Published online Dec 25, 2025. doi: 10.5527/wjn.v14.i4.112066
Published online Dec 25, 2025. doi: 10.5527/wjn.v14.i4.112066
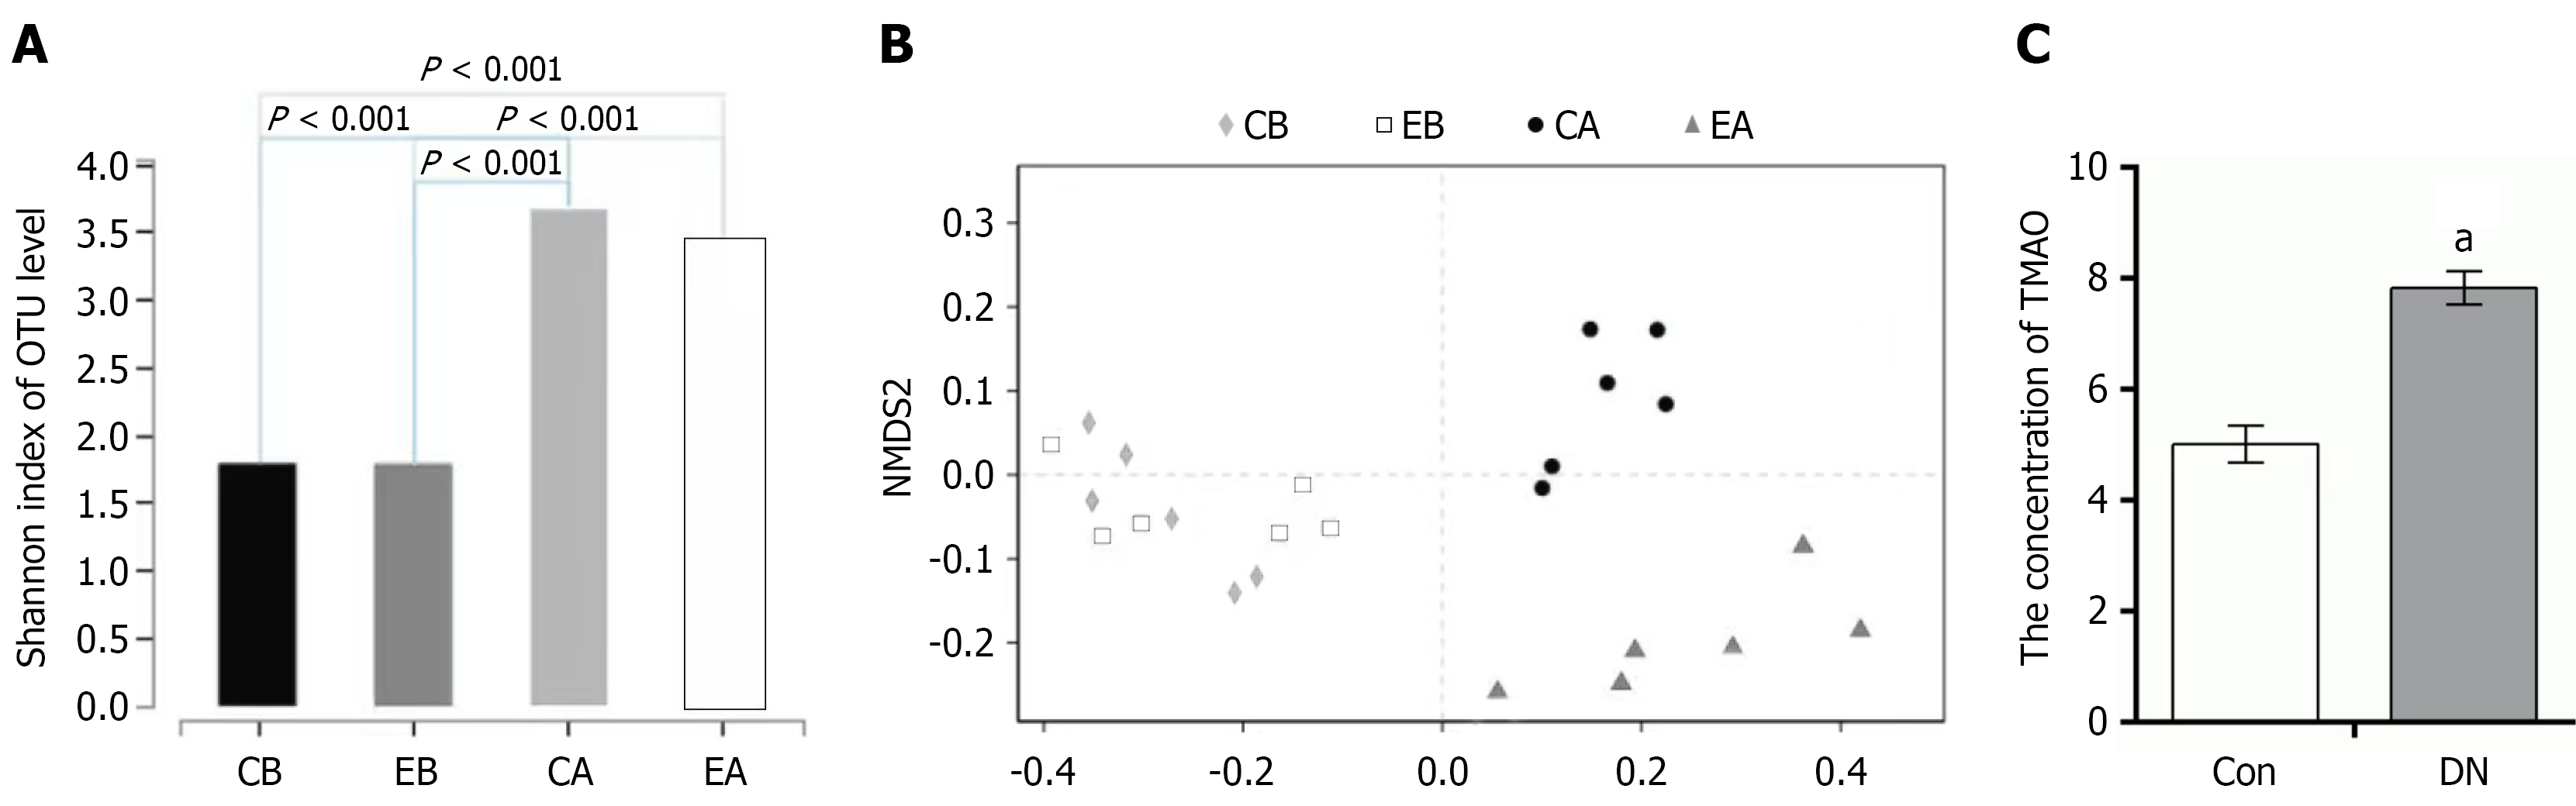
Figure 4 Analysis of gut microbiota and trimethylamine N-oxide before and after fecal microbiota transplantation.
aP < 0.01 compared with the control group. A: Shannon indexes before and after transplantation; B: Comparison of bacterial populations before and after fecal transplantation; C: Serum trimethylamine N-oxide content after fecal transplantation. CB: Control group before transplantation; EB: Experimental group before transplantation; CA: Control group after transplantation; EA: Experimental group before transplantation; OUT: Operational taxonomic unit; MMDS2: Non-metric multidimensional scaling; TMAO: Trimethylamine N-oxide; Con: Control group; DN: Diabetic nephropathy group.
- Citation: Song YJ, Yang B, Feng QS, Ma FF, Xing B, Bin XL, Ha XQ. Gut microbiota-derived trimethylamine N-oxide exacerbates diabetic nephropathy by promoting renal fibrosis. World J Nephrol 2025; 14(4): 112066
- URL: https://www.wjgnet.com/2220-6124/full/v14/i4/112066.htm
- DOI: https://dx.doi.org/10.5527/wjn.v14.i4.112066