
















©The Author(s) 2025.
World J Nephrol. Dec 25, 2025; 14(4): 112066
Published online Dec 25, 2025. doi: 10.5527/wjn.v14.i4.112066
Published online Dec 25, 2025. doi: 10.5527/wjn.v14.i4.112066
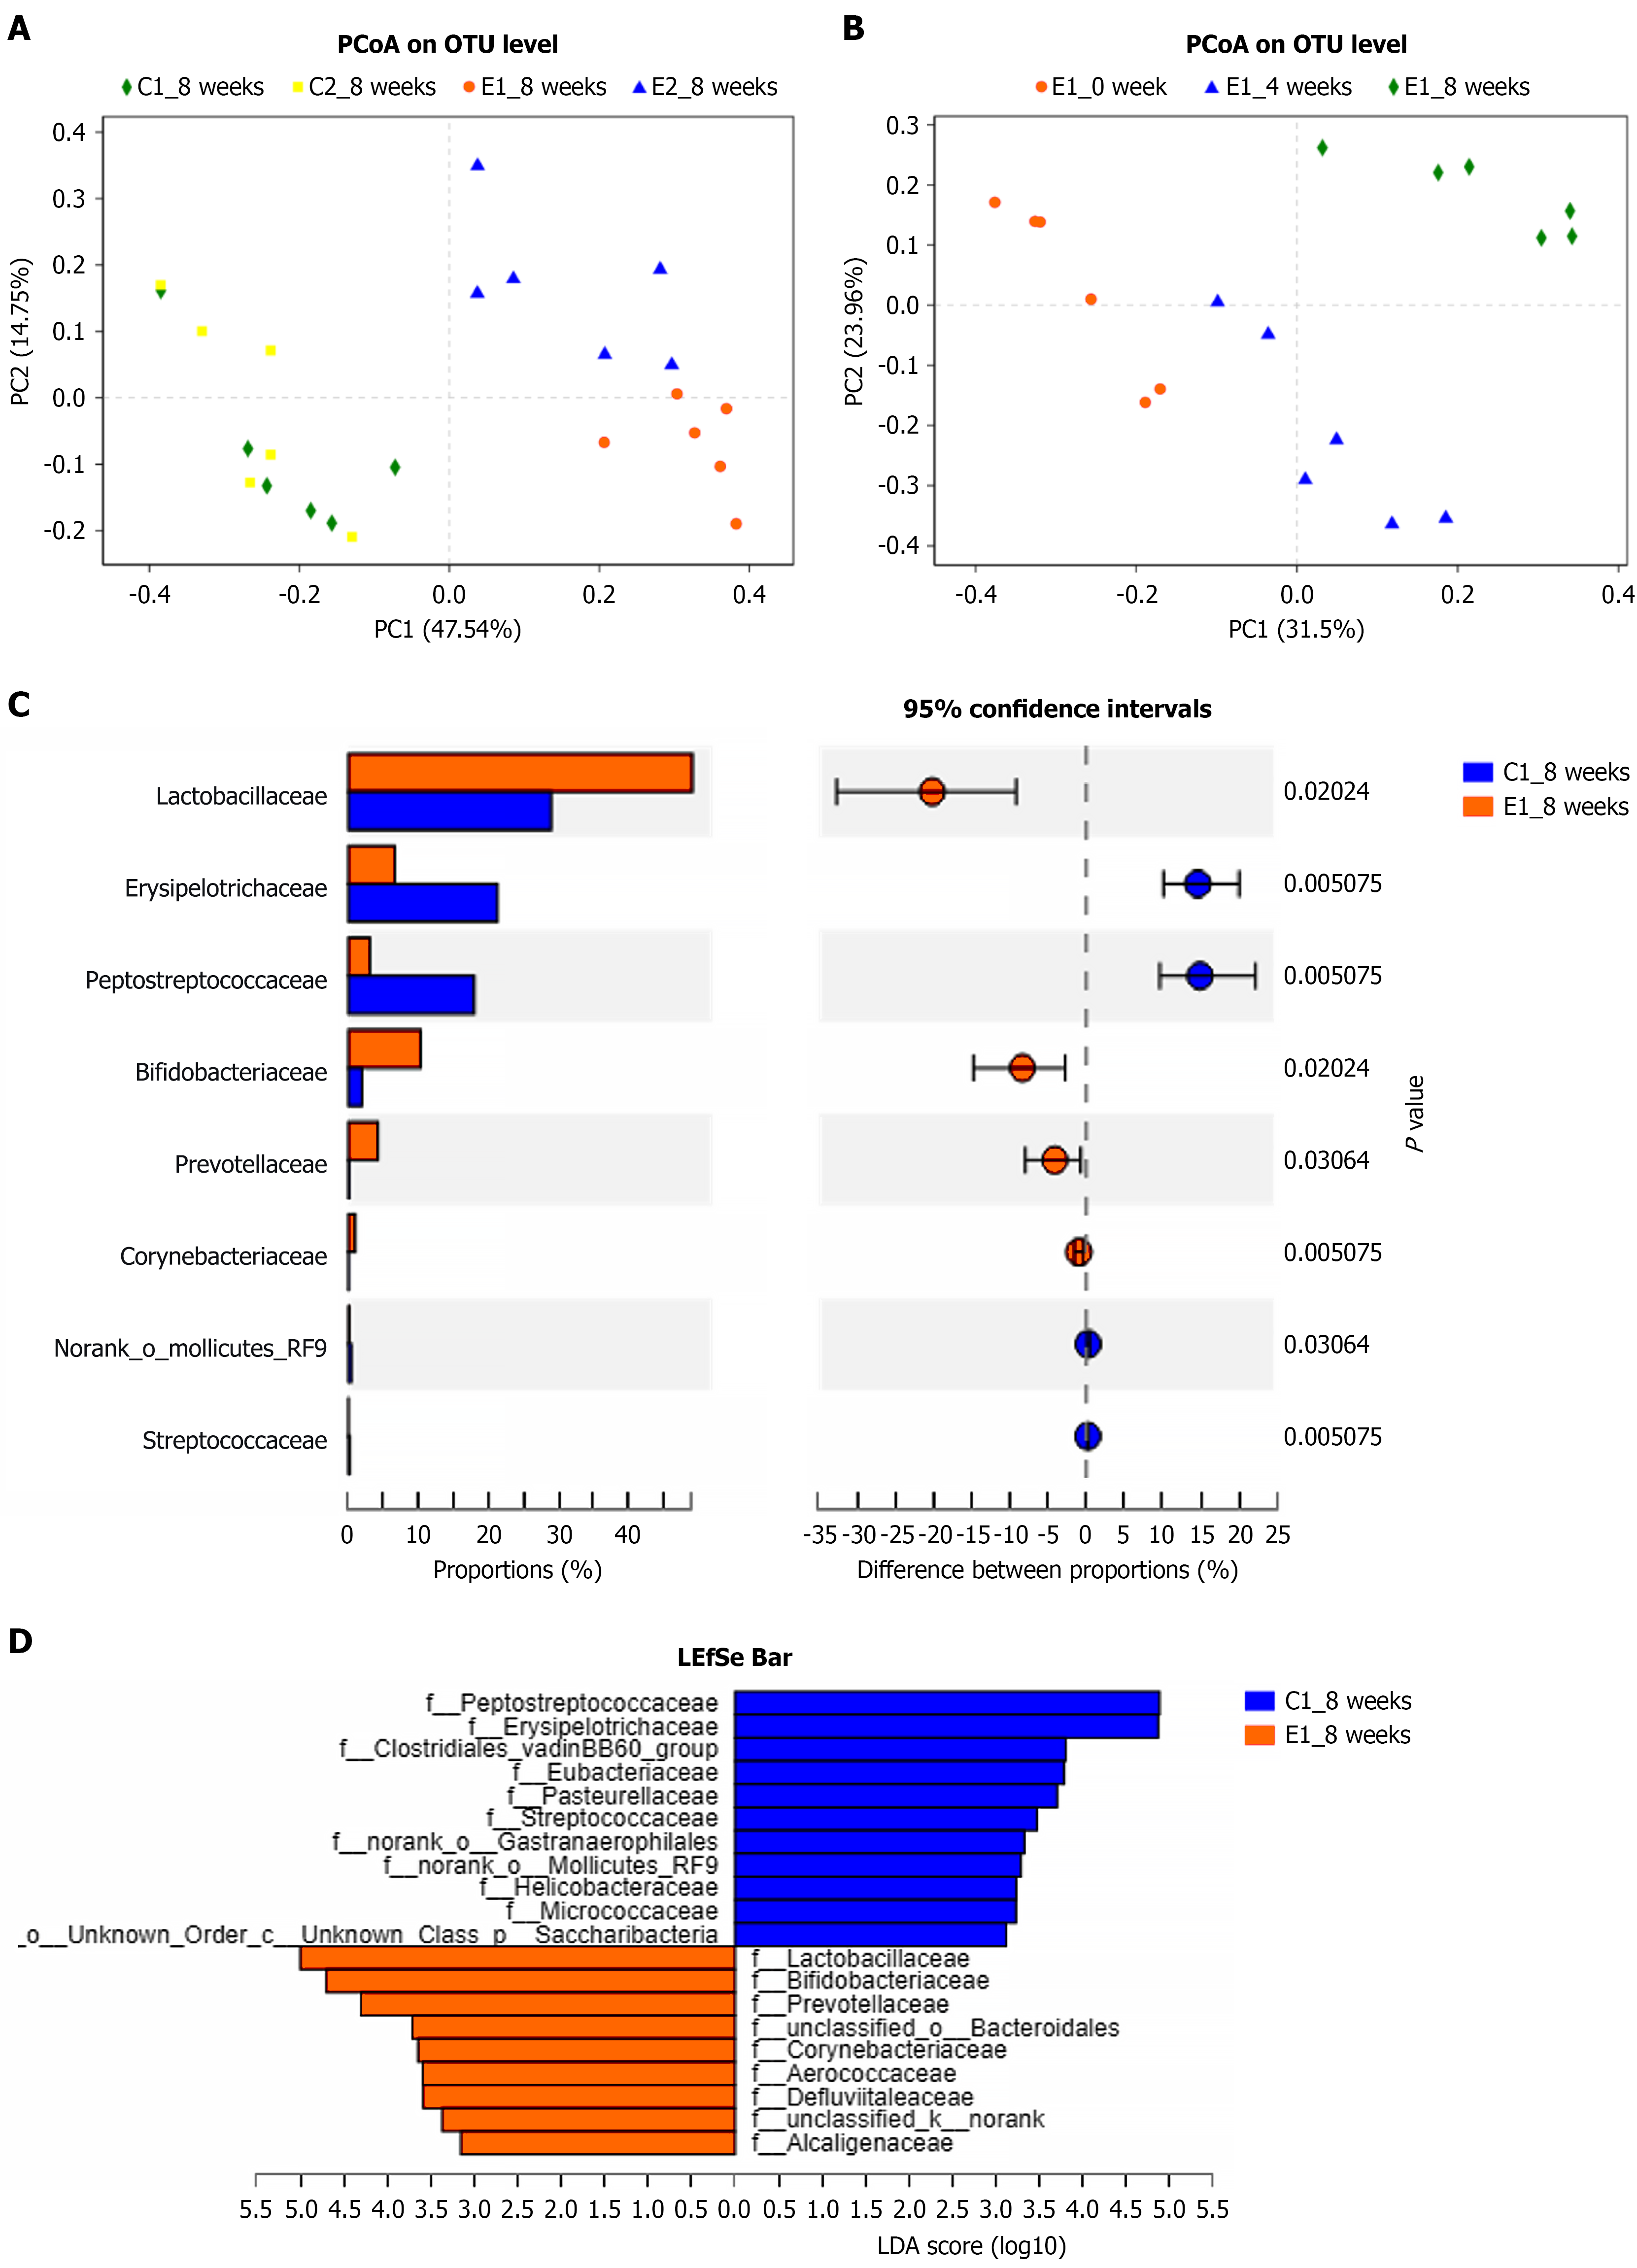
Figure 2 Integrated principal coordinate analysis and linear discriminant analysis effect size analysis reveals gut microbiota dynamics in a diabetic nephropathy rat model.
A: Principal coordinate analysis of the intestinal bacterial composition of the C1, C2, E1 and E2 groups at 8 weeks of modeling. PC1 and PC2 represent different influencing factors, the distance between samples indicates the degree of similarity between samples, and the percentage in parentheses represents the contribution of this coordinate; B: Principal coordinate analysis of the intestinal bacterial composition in the E1 group at 0 week, 4 weeks, and 8 weeks of modeling. As the modeling progressed, the gut microbiota of the E1 group also underwent significant changes; C: Results of the significance test between the E1 and C1 groups at the genus level. Different colors denote different groups, with the far right column displaying the P value; D: Linear discriminant analysis effect size multilevel species analysis of the E1 and C1 groups at the genus level. Through the above two methods of comparing intergroup differences in microbiota, it was demonstrated that the aforementioned microbiota underwent significant changes during the progression of diabetic nephropathy in Zucker diabetic fatty rats. PCoA: Principal coordinate analysis; OUT: Operational taxonomic unit; LDA: Linear discriminant analysis; LEfSe: Linear discriminant analysis effect size.
- Citation: Song YJ, Yang B, Feng QS, Ma FF, Xing B, Bin XL, Ha XQ. Gut microbiota-derived trimethylamine N-oxide exacerbates diabetic nephropathy by promoting renal fibrosis. World J Nephrol 2025; 14(4): 112066
- URL: https://www.wjgnet.com/2220-6124/full/v14/i4/112066.htm
- DOI: https://dx.doi.org/10.5527/wjn.v14.i4.112066