
















©The Author(s) 2025.
World J Nephrol. Dec 25, 2025; 14(4): 111613
Published online Dec 25, 2025. doi: 10.5527/wjn.v14.i4.111613
Published online Dec 25, 2025. doi: 10.5527/wjn.v14.i4.111613
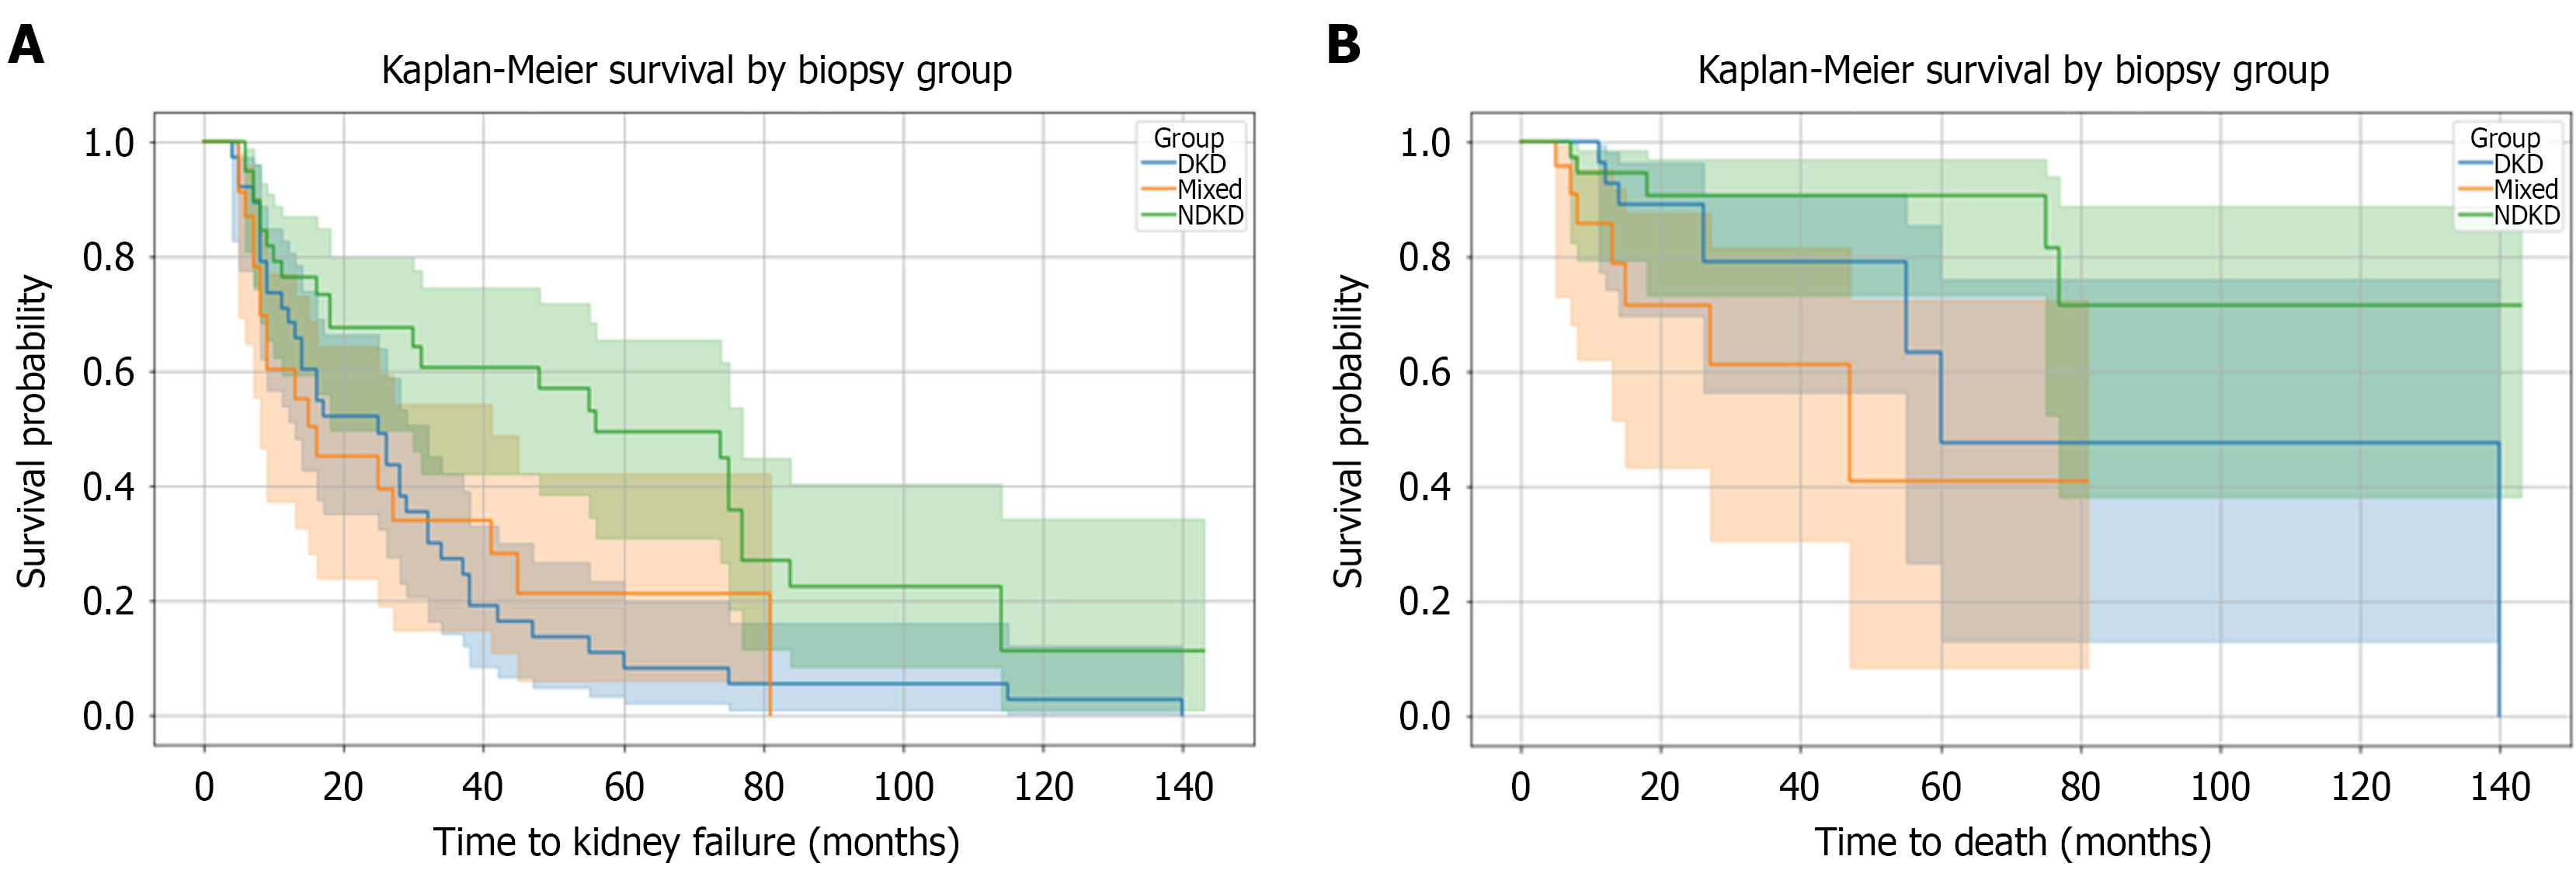
Figure 3 Kaplan-Meier curves.
A: Kaplan-Meier curves compare the time to kidney failure across three biopsy-based groups. The log-rank test P-value = 0.0033, indicating a statistically significant difference in kidney failure risk between the groups; B: Shows Kaplan-Meier survival curves comparing time to death between patients with diabetic kidney diseases, non-diabetic kidney diseases, and mixed lesions. Shaded areas show the 95% confidence intervals, representing uncertainty in survival estimates. The log-rank test P-value = 0.018, indicating a statistically significant difference in mortality across the groups. DKD: Diabetic kidney diseases; NDKD: Non-diabetic kidney diseases.
- Citation: Al-Qurashi SH, Khalil MAM, Mahmood HHK, A Al-Ghamdi R, Alsharif MM, Said Ahmed MA, Alghamdi RMH, Sadagah NM. Predictors of non-diabetic kidney disease in diabetics: A Saudi Arabian perspective. World J Nephrol 2025; 14(4): 111613
- URL: https://www.wjgnet.com/2220-6124/full/v14/i4/111613.htm
- DOI: https://dx.doi.org/10.5527/wjn.v14.i4.111613