
















©The Author(s) 2025.
World J Nephrol. Sep 25, 2025; 14(3): 108534
Published online Sep 25, 2025. doi: 10.5527/wjn.v14.i3.108534
Published online Sep 25, 2025. doi: 10.5527/wjn.v14.i3.108534
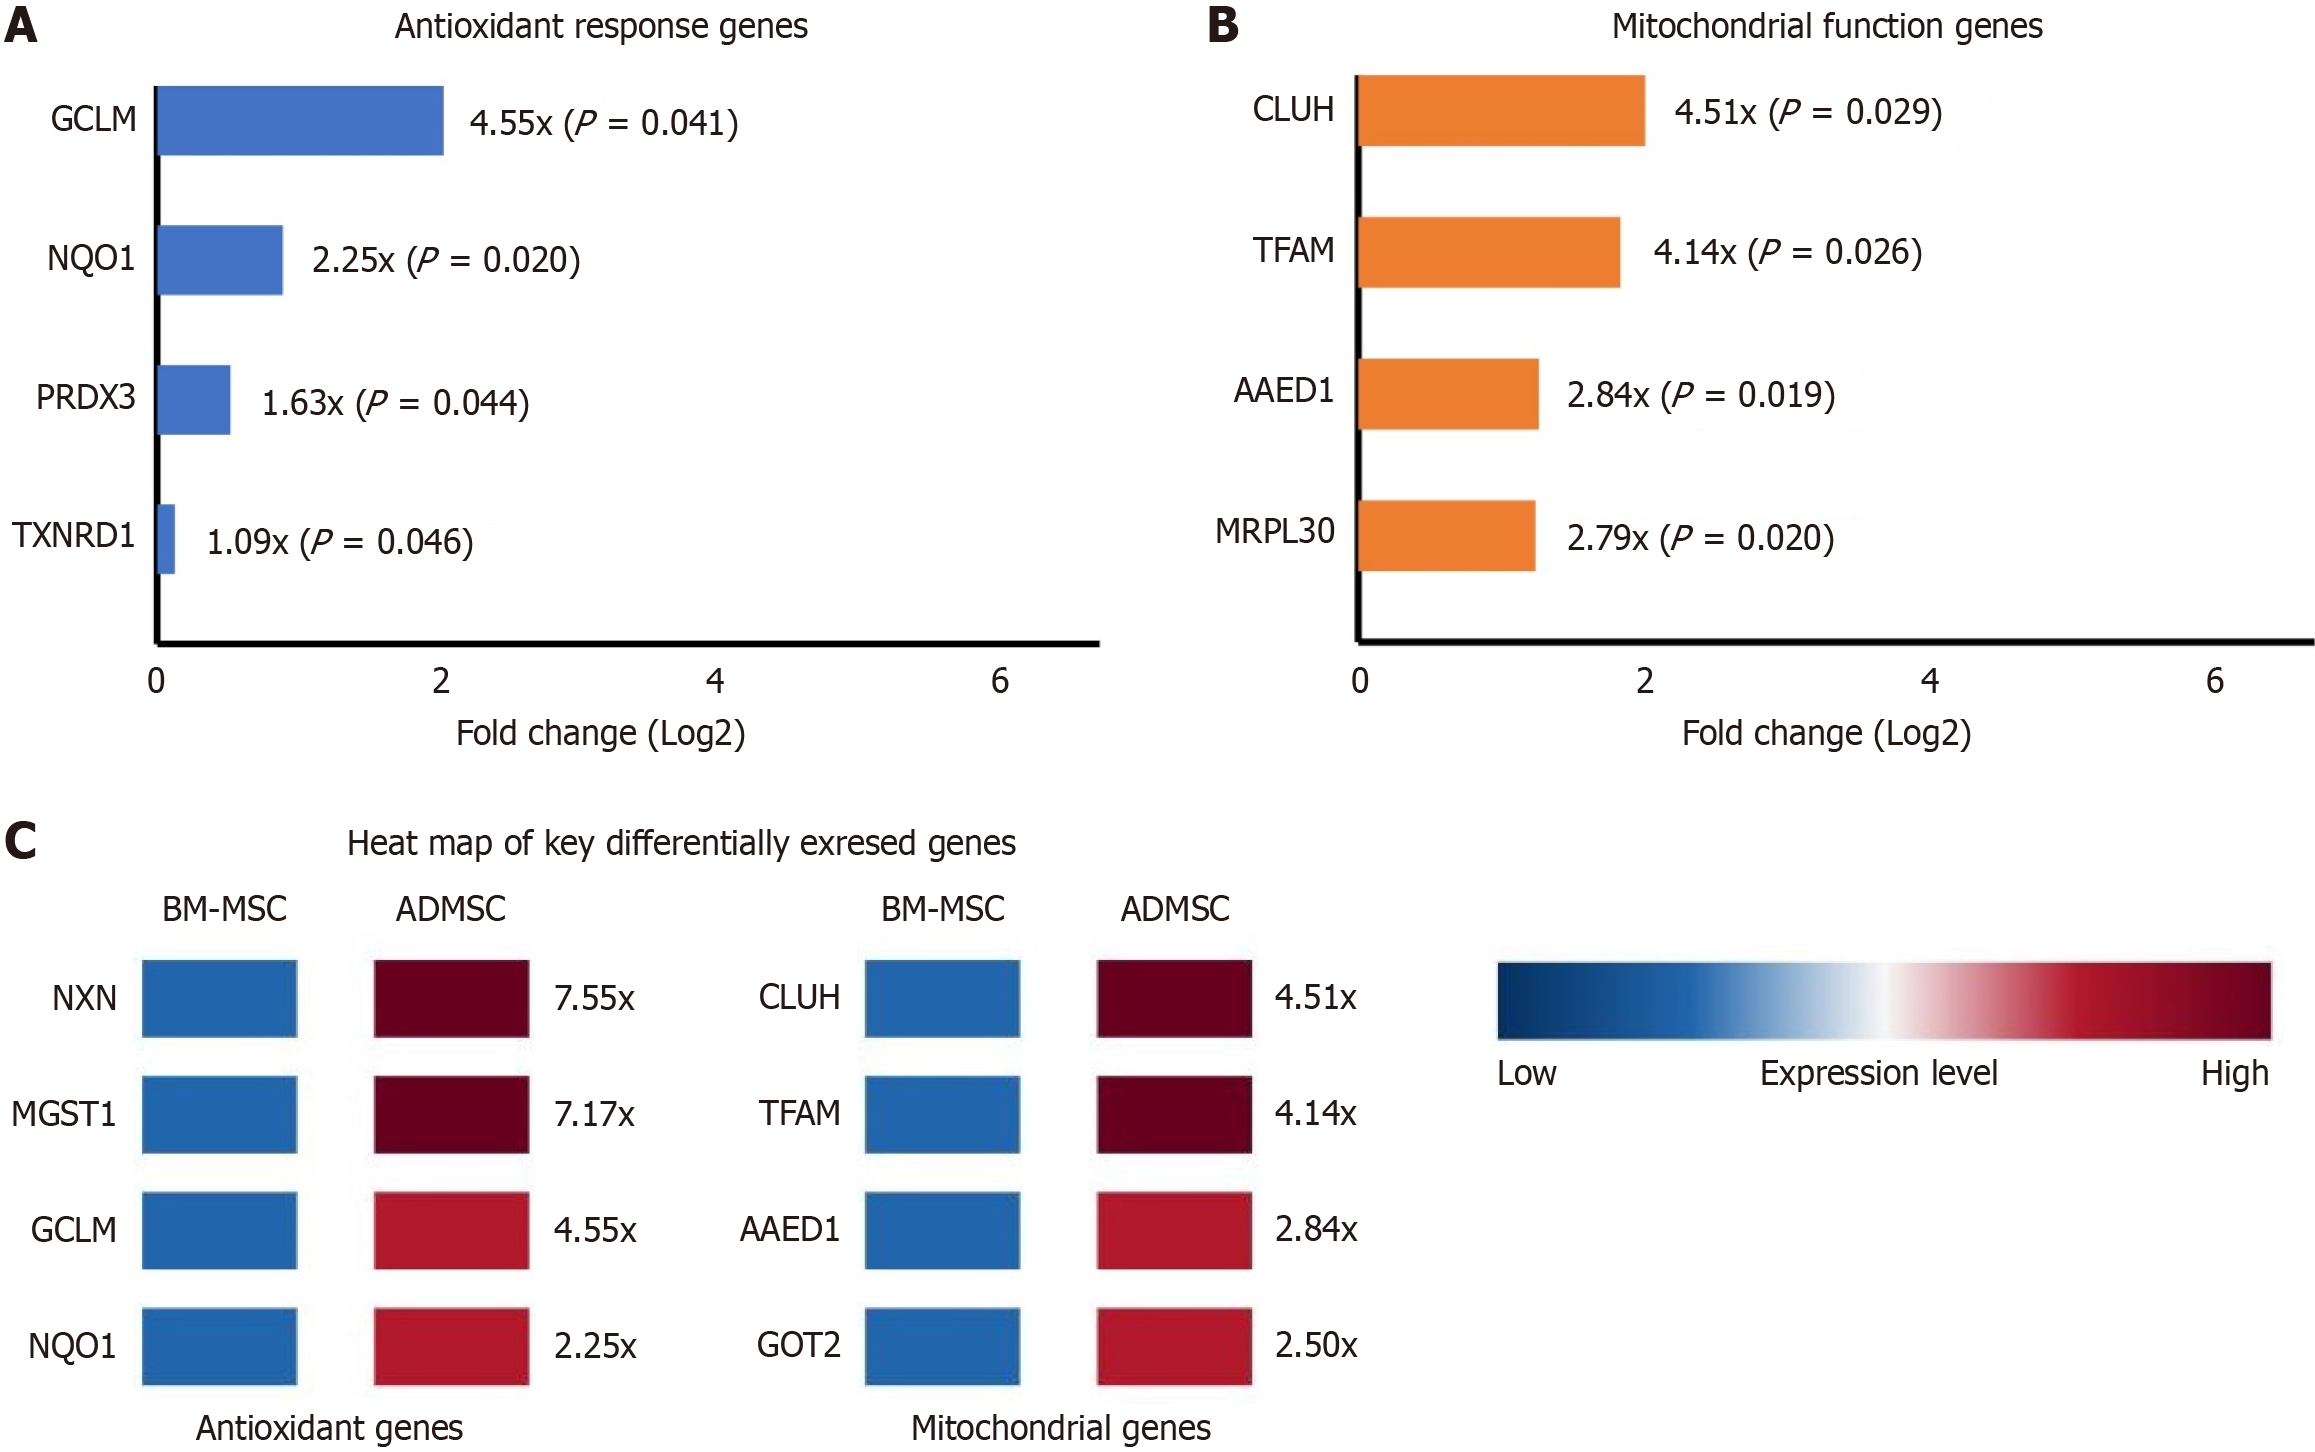
Figure 3 Differential expression of antioxidant and mitochondrial function-related genes in adipose-derived mesenchymal stromal cells compared to bone marrow-derived mesenchymal stromal cells.
A: Bar graph illustrating upregulated antioxidant response genes in adipose-derived mesenchymal stromal cells (ADMSCs), including glutamate-cysteine ligase modifier subunit (GCLM), NAD(P)H quinone dehydrogenase 1 (Nqo1), peroxiredoxin 3 (PRDX3), and thioredoxin reductase 1 (TXNRD1), shown as fold change (Log2) relative to bone marrow-derived MSCs (BM-MSCs). Statistical significance is indicated by P values; B: Bar graph showing upregulation of mitochondrial function genes clustered mitochondria homolog (CLUH), transcription factor A mitochondrial (TFAM), AhpC/TSA antioxidant enzyme domain containing 1 (AAED1), and mitochondrial ribosomal protein L30 (MRPL30) in ADMSCs vs BM-MSCs; C: Heatmap of key differentially expressed genes related to antioxidant defense and mitochondrial function, comparing gene expression levels between BM-MSCs and ADMSCs. Expression values are represented on a color scale from low (blue) to high (red), with corresponding fold change indicated.
- Citation: Jafar H, Ababneh NA, Alhattab D, Alatoom RM, Zalloum S, Salah B, Alhawari H, Awidi A. Adipose-derived mesenchymal stromal cell secretome protects against kidney injury through induction of heme oxygenase 1 upregulation in vitro. World J Nephrol 2025; 14(3): 108534
- URL: https://www.wjgnet.com/2220-6124/full/v14/i3/108534.htm
- DOI: https://dx.doi.org/10.5527/wjn.v14.i3.108534