Copyright
©The Author(s) 2018.
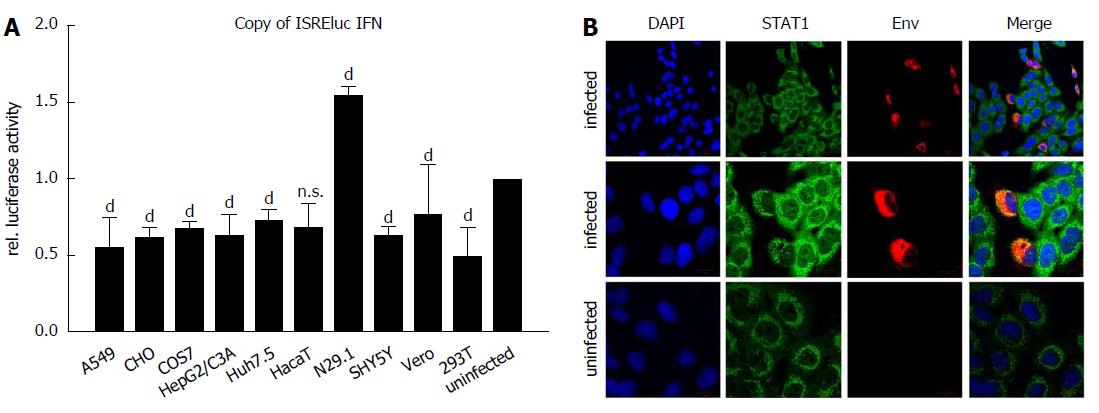
Figure 4 Delocalization of STAT1 in Zika virus-infected cells.
A: The indicated cell lines were either infected with a MOI = 0.1 or left uninfected and directly afterwards transfection with the pISREluc reporter was performed. 16 h later the cells were washed once with PBS and luciferase activity was measured 48 hpi. The data are from three independent experiments and for each cell line the uninfected controls were set as one, acting as the reference. The bars represent the standard errors of the mean. Statistical analysis was done by using 2-way ANOVA with Vero cells as reference value. bP < 0.01, dP < 0.0001; B: Detection of STAT1 by confocal immunofluorescence microscopy of ZIKV-infected and uninfected A549 cells. Cells were grown on cover slips and infected with a MOI of 0.1 using ZIKV Polynesia strain. 6 h after infection the cells were fixed with ethanol. Detection of STAT1 was performed using the green channel and Zika specific staining was performed using an envelope-specific antibody (green fluorescence). Nuclei were stained by DAPI (blue fluorescence). The pictures were taken at 450-fold and 1000-fold magnification respectively (scale bars represent 10 μm). ZIKV: Zika virus.
- Citation: Himmelsbach K, Hildt E. Identification of various cell culture models for the study of Zika virus. World J Virol 2018; 7(1): 10-20
- URL: https://www.wjgnet.com/2220-3249/full/v7/i1/10.htm
- DOI: https://dx.doi.org/10.5501/wjv.v7.i1.10


