Copyright
©The Author(s) 2017.
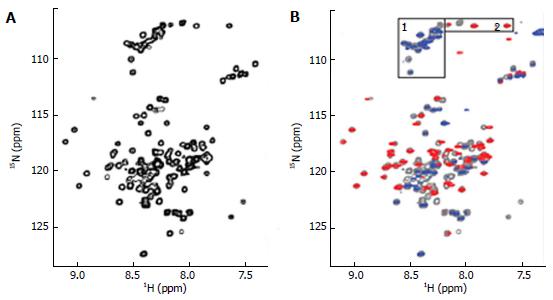
Figure 4 Nuclear magnetic resonance spectra of 15N labeled ∆60HDAg.
A: 1H-15N HSQC of ∆60HDAg recorded on a Bruker 600 MHz Avance II NMR instrument at 25 °C with the standard Bruker pulse sequence: hsqcetfpf3gpsi. Four thousand and ninety-eight data points in 1H dimension and 256 increments in 15N dimension were acquired; B: 1H and 15N heteronuclear NOE spectrum of ∆60HDAg, superimposed on the normal 1H-15N HSQC spectrum (gray contours). Heteronuclear NOE spectrum was recorded with the Bruker pulse sequence: Hsqcnoef3gpsi. Positives and negatives are displayed in red and blue contours, respectively. Peaks from glycines (boxed and labeled as 1 and 2 in the top of the spectra) are grouped.
- Citation: Alves C, Cheng H, Tavanez JP, Casaca A, Gudima S, Roder H, Cunha C. Structural and nucleic acid binding properties of hepatitis delta virus small antigen. World J Virol 2017; 6(2): 26-35
- URL: https://www.wjgnet.com/2220-3249/full/v6/i2/26.htm
- DOI: https://dx.doi.org/10.5501/wjv.v6.i2.26


