Copyright
©The Author(s) 2017.
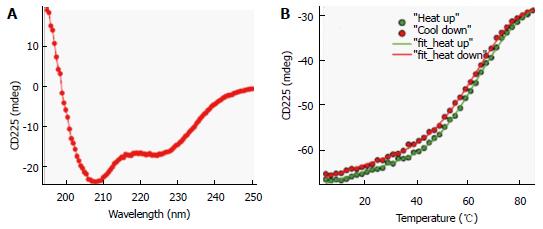
Figure 3 Circular dichroism spectrum and protein thermal stability measurement of ∆60HDAg.
A: Far-UV CD spectrum of approximately 10 μmol/L protein in 20 mmol/L potassium phosphate buffer, pH 6.3 at 25 °C. A quartz cuvette with 1 mm pathlength was used. The spectrum is an average of five scans recorded in the far-UV region (195-250 nm) with a band pass of 2 nm; B: Temperature dependence of ∆60HDAg at approximately 15 μmol/L. Change in ellipticity at 225 nm upon increasing the temperature from 5 °C to 85 °C in 2 °C intervals was recorded. Two nanometer band width and a 2 mm quartz cuvette were used. Data average and temperature equilibrate times were 1 s and 12 s, respectively. Solid lines are the nonlinear least squares fitting the experiment data (solid circles) to the Gibbs-Helmholtz equation (see Materials and Methods). CD: Circular dichroism.
- Citation: Alves C, Cheng H, Tavanez JP, Casaca A, Gudima S, Roder H, Cunha C. Structural and nucleic acid binding properties of hepatitis delta virus small antigen. World J Virol 2017; 6(2): 26-35
- URL: https://www.wjgnet.com/2220-3249/full/v6/i2/26.htm
- DOI: https://dx.doi.org/10.5501/wjv.v6.i2.26


