Copyright
©The Author(s) 2017.
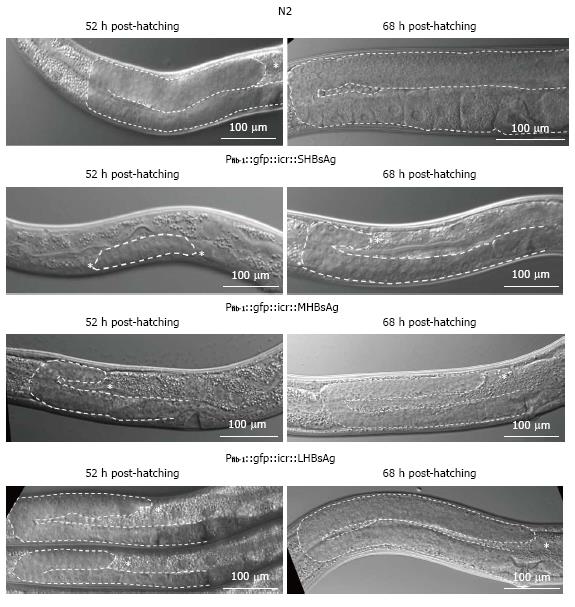
Figure 2 Differential interference contrast micrographs of gonad development in transgenic worms at various post-hatching times.
The upper row shows a wild-type worm (N2); the second row shows a transgenic worm expressing SHBsAg; the third row shows a transgenic worm expressing MHBsAg; and the bottom row shows a transgenic worm expressing LHBsAg. The right column shows the gonads at 52 h post-hatching and the left column at shows gonads at 68 h post-hatching expect the worm expressing SHBsAg is at 72 h post-hatching. The gonad contour is indicated with dotted lines and the tip (distal end) is marked by asterisk.
- Citation: Chen YY, Lee LW, Hong WN, Lo SJ. Expression of hepatitis B virus surface antigens induces defective gonad phenotypes in Caenorhabditis elegans. World J Virol 2017; 6(1): 17-25
- URL: https://www.wjgnet.com/2220-3249/full/v6/i1/17.htm
- DOI: https://dx.doi.org/10.5501/wjv.v6.i1.17


