Copyright
©The Author(s) 2015.
World J Virology. Nov 12, 2015; 4(4): 365-371
Published online Nov 12, 2015. doi: 10.5501/wjv.v4.i4.365
Published online Nov 12, 2015. doi: 10.5501/wjv.v4.i4.365
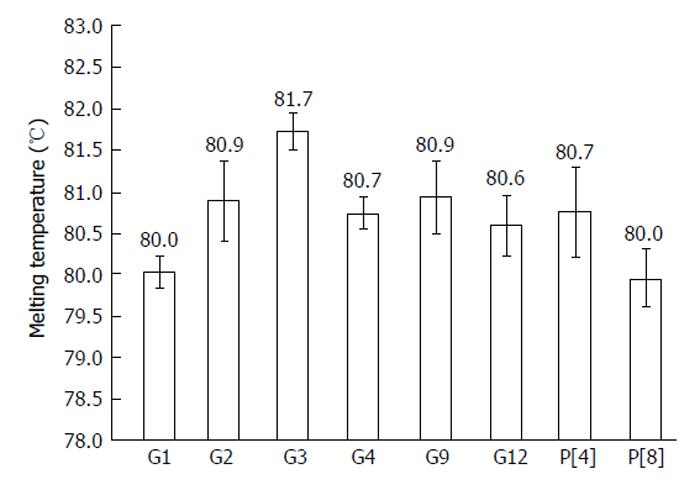
Figure 2 Melting temperatures of different rotavirus genotypes using reverse transcriptase polymerase chain reaction.
The mean Tm (°C ± SD) for each genotype (G1 to G4, G9, G12, P[4] and P[8]) were calculated from more than 20 replicates of different samples at different polymerase chain reaction runs.
- Citation: Tong Y, Lee BE, Pang XL. Rapid genotyping of human rotavirus using SYBR green real-time reverse transcription-polymerase chain reaction with melting curve analysis. World J Virology 2015; 4(4): 365-371
- URL: https://www.wjgnet.com/2220-3249/full/v4/i4/365.htm
- DOI: https://dx.doi.org/10.5501/wjv.v4.i4.365


