Copyright
©The Author(s) 2015.
World J Virology. Nov 12, 2015; 4(4): 365-371
Published online Nov 12, 2015. doi: 10.5501/wjv.v4.i4.365
Published online Nov 12, 2015. doi: 10.5501/wjv.v4.i4.365
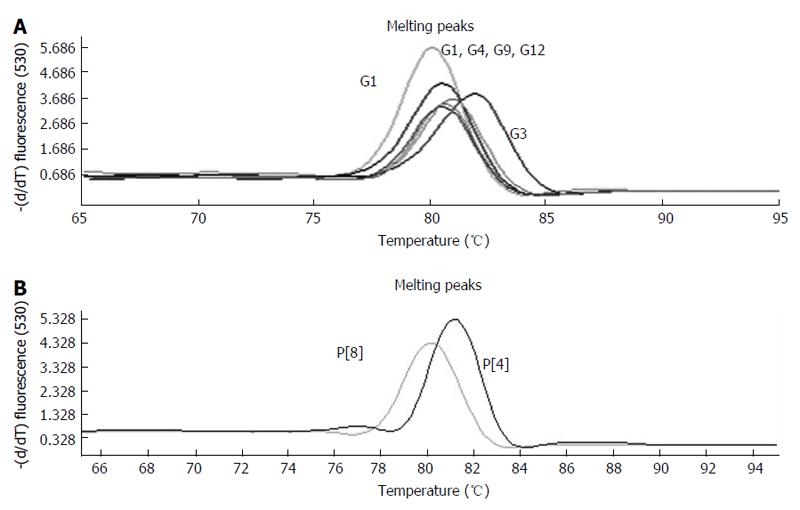
Figure 1 Melting cure analysis of different genotypes using reverse transcriptase polymerase chain reaction (A: G-typing: G1, G2, G4, G9, G12, G3; B: P-typing: P[8], P[4]).
The peak of curve in X-axis is the melting temperature of each genotype DNA fragment; Y-axis indicates the SYB green fluorescence density.
- Citation: Tong Y, Lee BE, Pang XL. Rapid genotyping of human rotavirus using SYBR green real-time reverse transcription-polymerase chain reaction with melting curve analysis. World J Virology 2015; 4(4): 365-371
- URL: https://www.wjgnet.com/2220-3249/full/v4/i4/365.htm
- DOI: https://dx.doi.org/10.5501/wjv.v4.i4.365


