Copyright
©The Author(s) 2016.
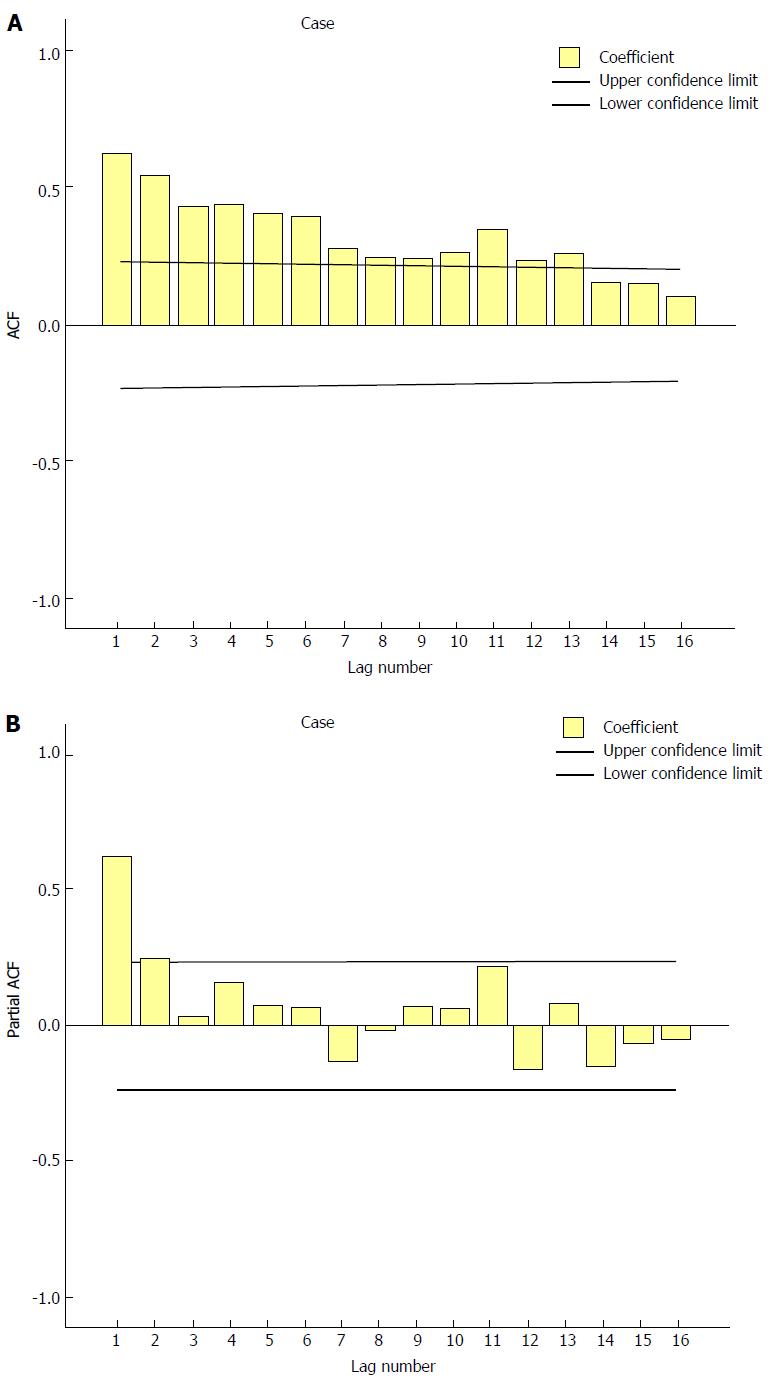
Figure 1 Correlogram and partial correlogram for a case structure control used for autoregressive integrated moving average model.
A: ACF; B: Partial ACF. ACF: Autocorrelation function.
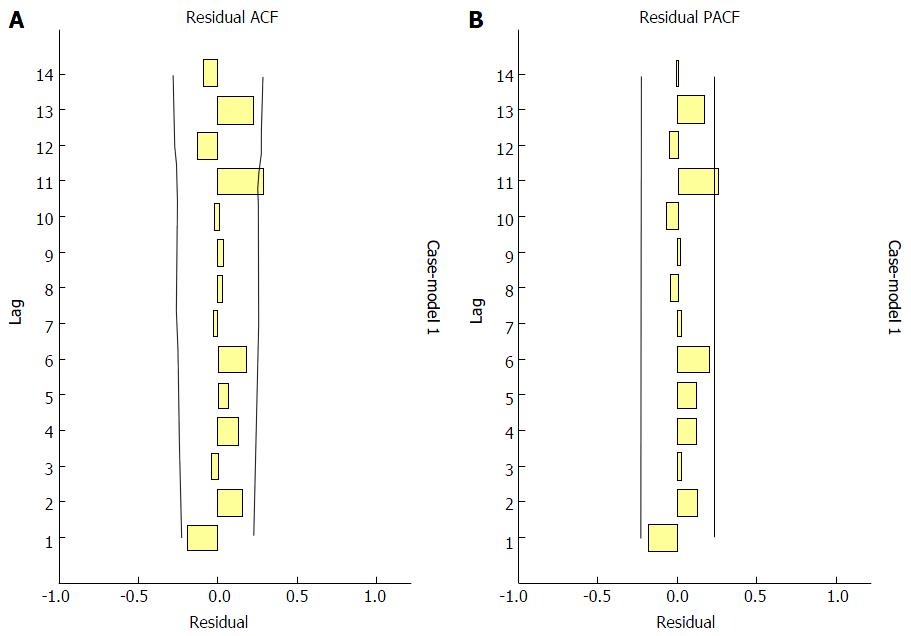
Figure 2 Residual plots for the final autoregressive integrated moving average (2, 1, 7) model of hepatitis C virus seroprevalence among volunteer blood donors in Libya, 2008-2013.
A: ACF; B: Partial ACF. Lines indicate 95%CI. ACF: Autocorrelation function.
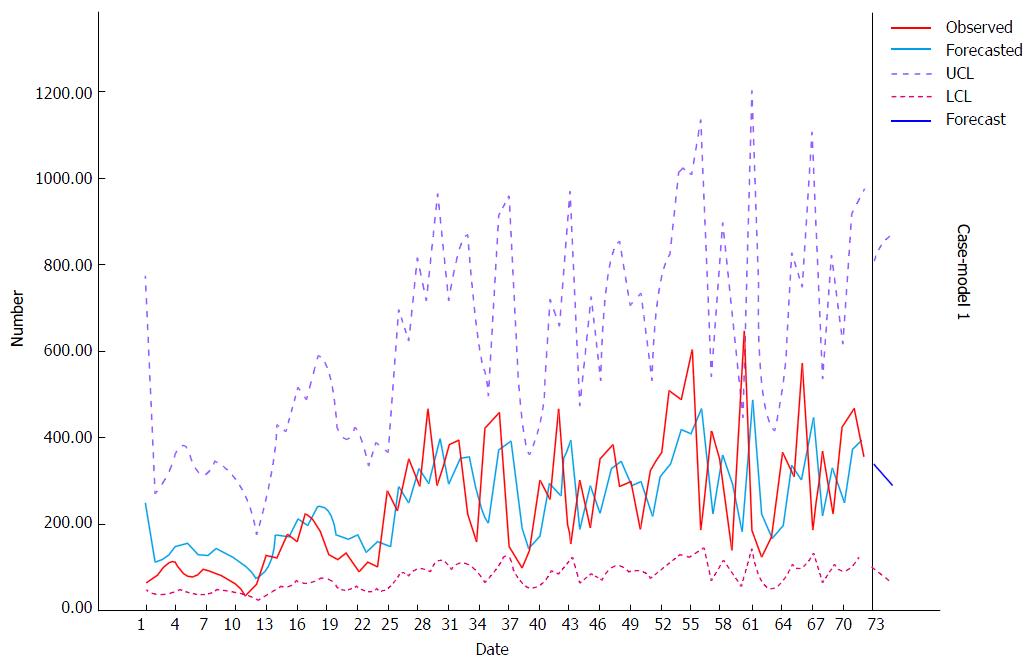
Figure 3 Number of observed and forecast hepatitis C virus seropositive volunteers among blood donors in Libya, 2008-2013.
Date: Period of observation (months: 2008-2013); Number: Estimated number of HCV seropositive/month. UCL: Upper confidence limit; LCL: Lower confidence limit; HCV: Hepatitis C virus.
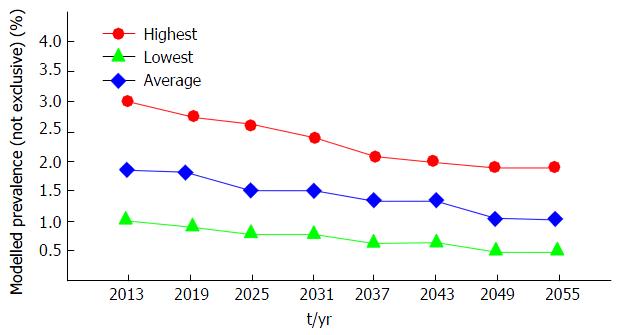
Figure 4 Modeled prevalence (not exclusive1) of hepatitis C virus infection by 6-year period, Libya, 2008-2055.
1Estimates assume stable risk populations and HCV infection risks and do not adjust for treatment. HCV: Hepatitis C virus.
- Citation: Daw MA, Shabash A, El-Bouzedi A, Dau AA, Habas M, Libyan Study Group of Hepatitis and HIV. Modelling the prevalence of hepatitis C virus amongst blood donors in Libya: An investigation of providing a preventive strategy. World J Virol 2016; 5(1): 14-22
- URL: https://www.wjgnet.com/2220-3249/full/v5/i1/14.htm
- DOI: https://dx.doi.org/10.5501/wjv.v5.i1.14


