Copyright
©2014 Baishideng Publishing Group Inc.
World J Transplant. Dec 24, 2014; 4(4): 276-293
Published online Dec 24, 2014. doi: 10.5500/wjt.v4.i4.276
Published online Dec 24, 2014. doi: 10.5500/wjt.v4.i4.276
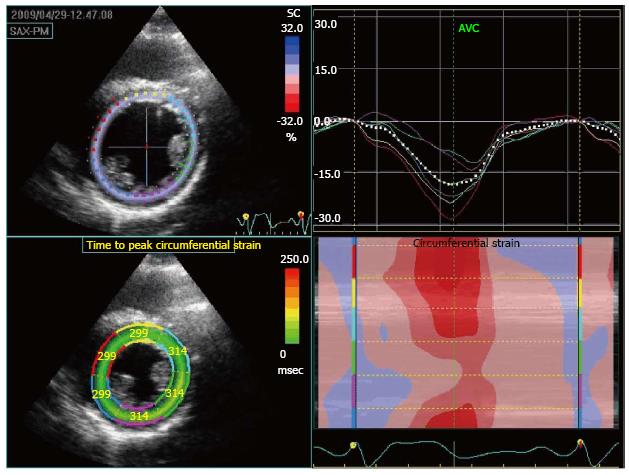
Figure 6 Speckle-tracking echocardiographic analysis of myocardial deformation showing circumferential strain in a patient with coronary allograft vasculopathy.
On the top right image we can appreciate the dyssinchrony (later contraction compared to the rest of the segments) and lower contractility of the green and purple segment corresponding to LCX territory. On the bottom right figure, we can appreciate how the same green and purple segments have significant lower contractility than the others (red corresponds to the maximum contractility and blue to the absence of it). The left superior panel shows the color coding for each of the segments. The left inferior panel shows the time interval between beginning of QRS and maximal strain value.
- Citation: Dedieu N, Greil G, Wong J, Fenton M, Burch M, Hussain T. Diagnosis and management of coronary allograft vasculopathy in children and adolescents. World J Transplant 2014; 4(4): 276-293
- URL: https://www.wjgnet.com/2220-3230/full/v4/i4/276.htm
- DOI: https://dx.doi.org/10.5500/wjt.v4.i4.276


