
















Copyright: ©Author(s) 2026.
World J Transplant. Sep 18, 2026; 16(3): 121821
Published online Sep 18, 2026. doi: 10.5500/wjt.121821
Published online Sep 18, 2026. doi: 10.5500/wjt.121821
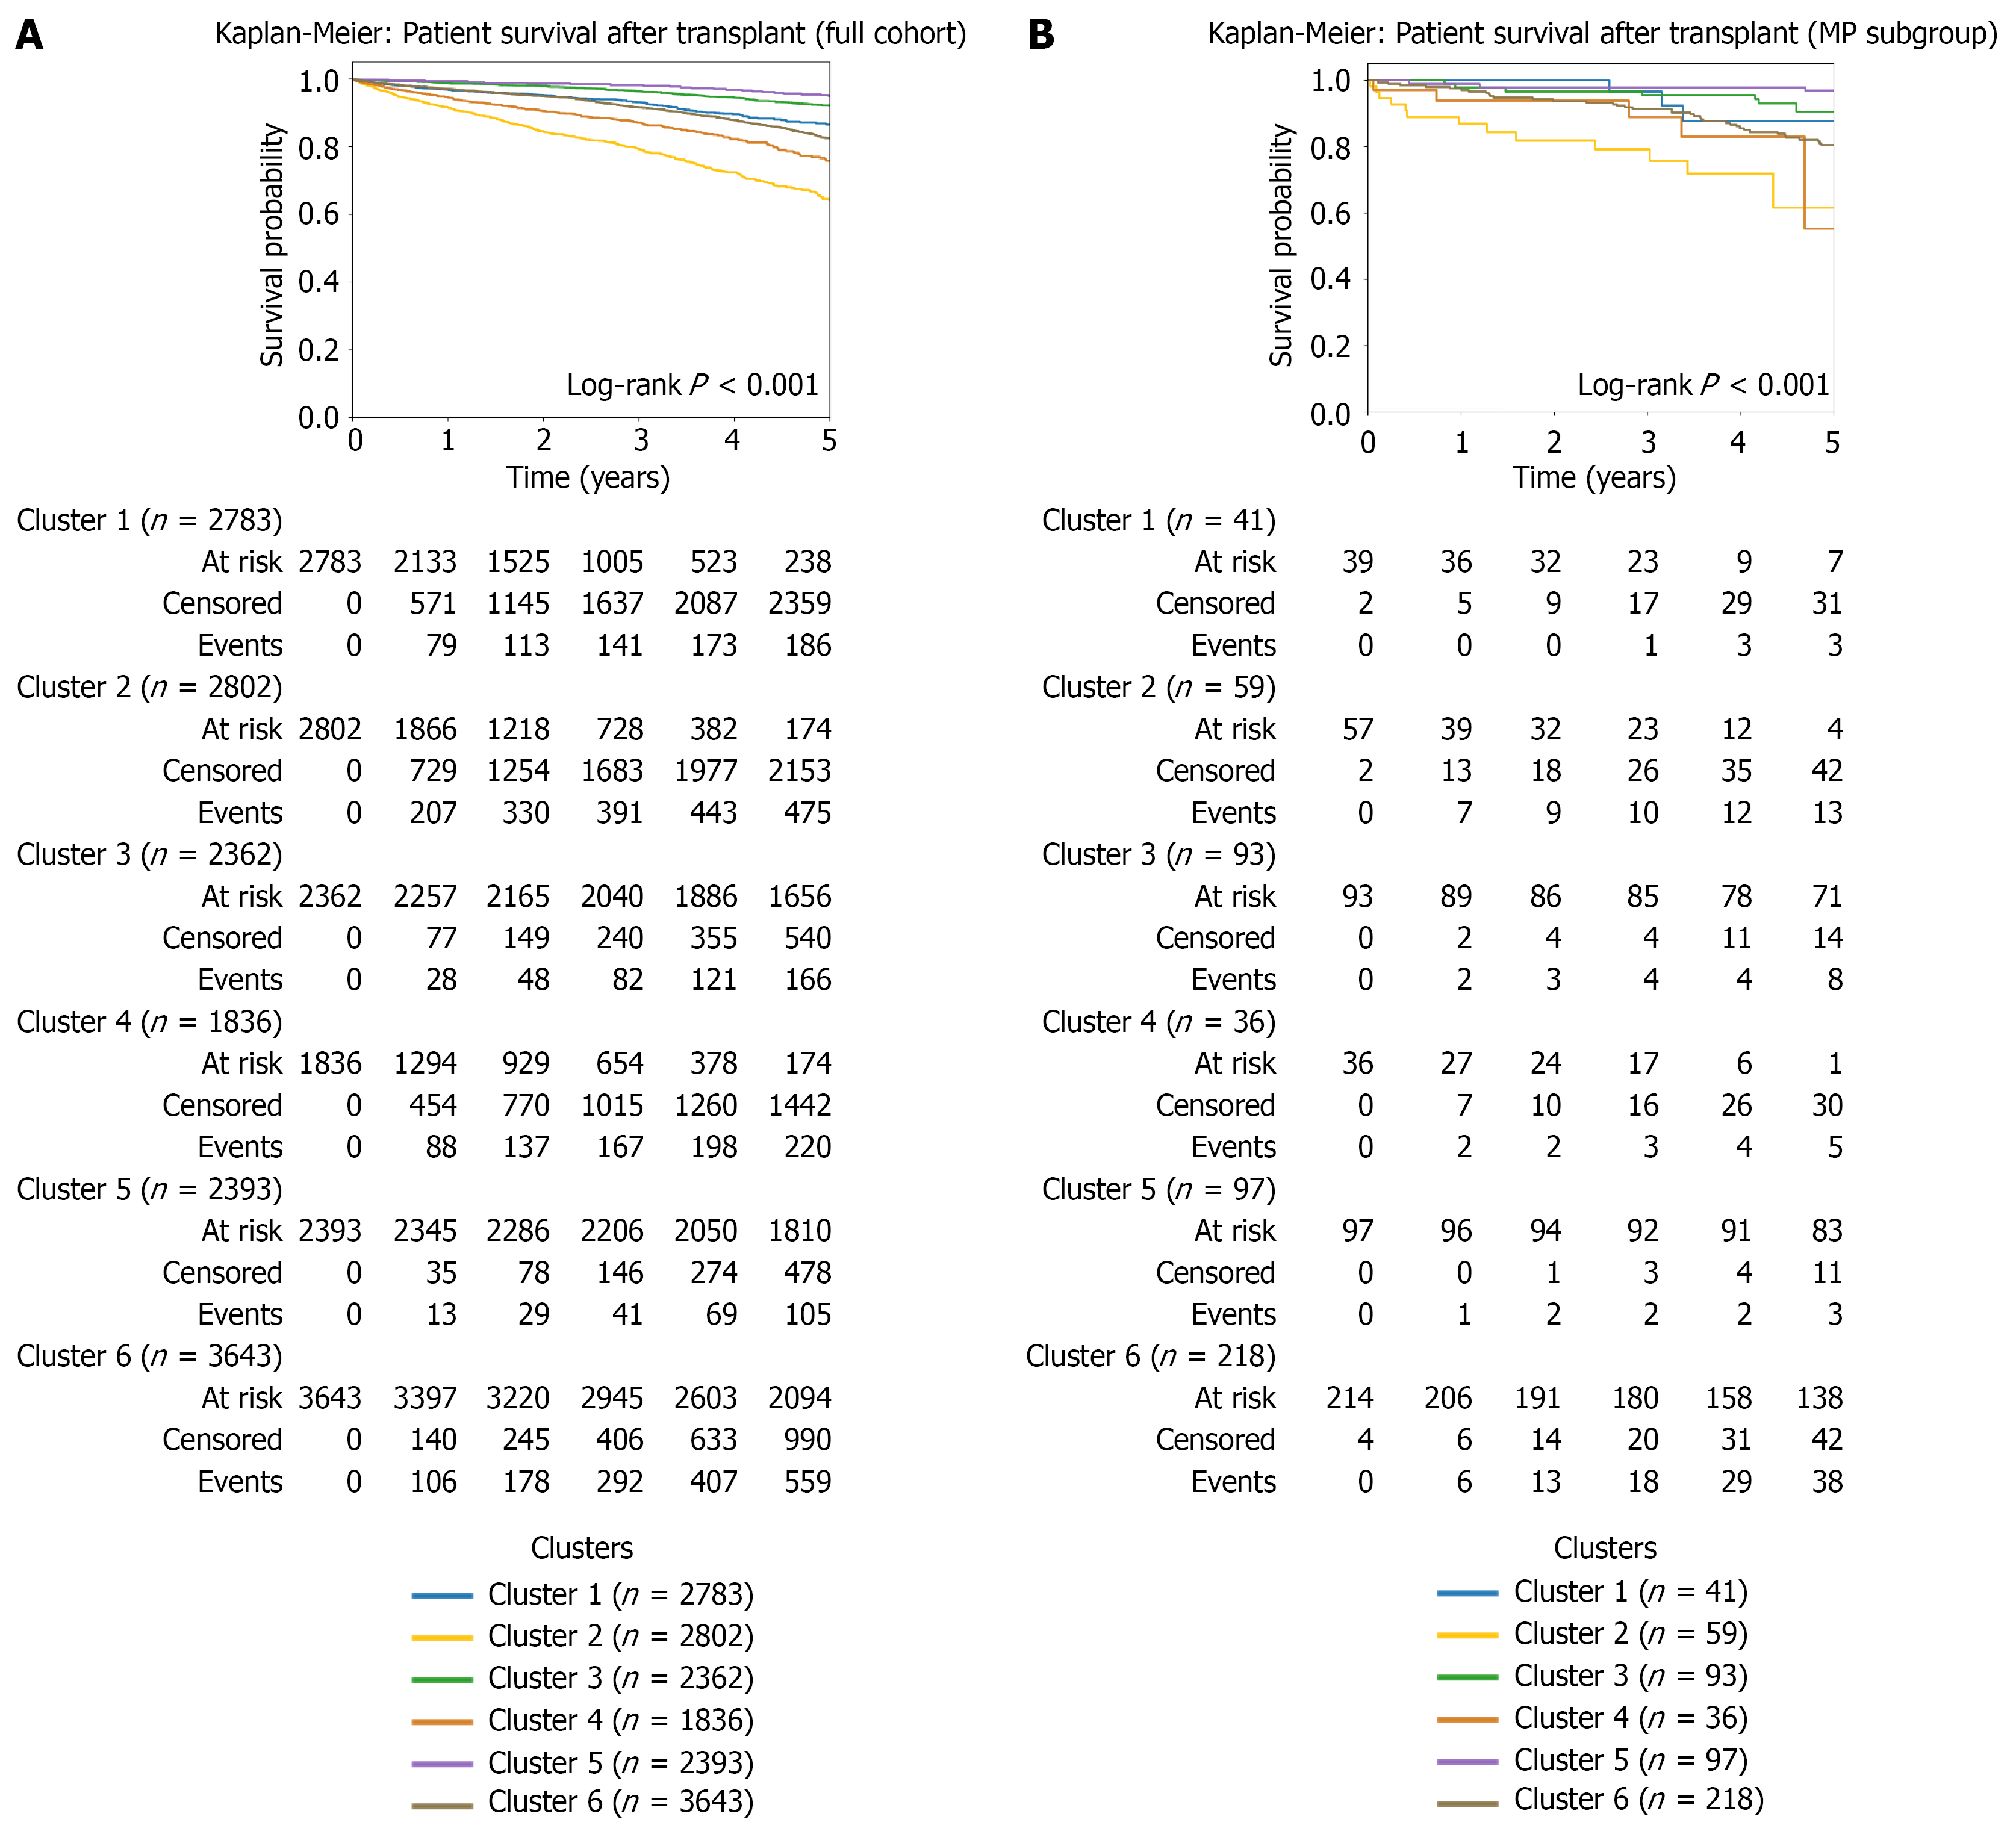
Figure 9 Patient survival Kaplan-Meier curves for the full cohort (n = 15904) and the machine perfusion subgroup (n = 544).
Time zero represents the date of transplantation, with patients followed for up to 5 years. The y-axis shows overall survival probability. Numbers at risk are displayed below each panel. Survival differences between clusters were evaluated using the log-rank test; P values are displayed. Cluster 4 showed a marked decrease in 5-year patient survival in the machine perfusion subgroup compared with the full cohort (57% vs 78%), making it the worst-performing cluster in this population. A: The full cohort; B: The machine perfusion subgroup. MP: Machine perfusion.
- Citation: Castellanos De Brigard J, Rangganata E, Papalois VE. Machine perfusion distribution across clinical phenotypes in kidney transplantation: A national cohort study using unsupervised clustering. World J Transplant 2026; 16(3): 121821
- URL: https://www.wjgnet.com/2220-3230/full/v16/i3/121821.htm
- DOI: https://dx.doi.org/10.5500/wjt.121821