
















Copyright: ©Author(s) 2026.
World J Transplant. Sep 18, 2026; 16(3): 121821
Published online Sep 18, 2026. doi: 10.5500/wjt.121821
Published online Sep 18, 2026. doi: 10.5500/wjt.121821
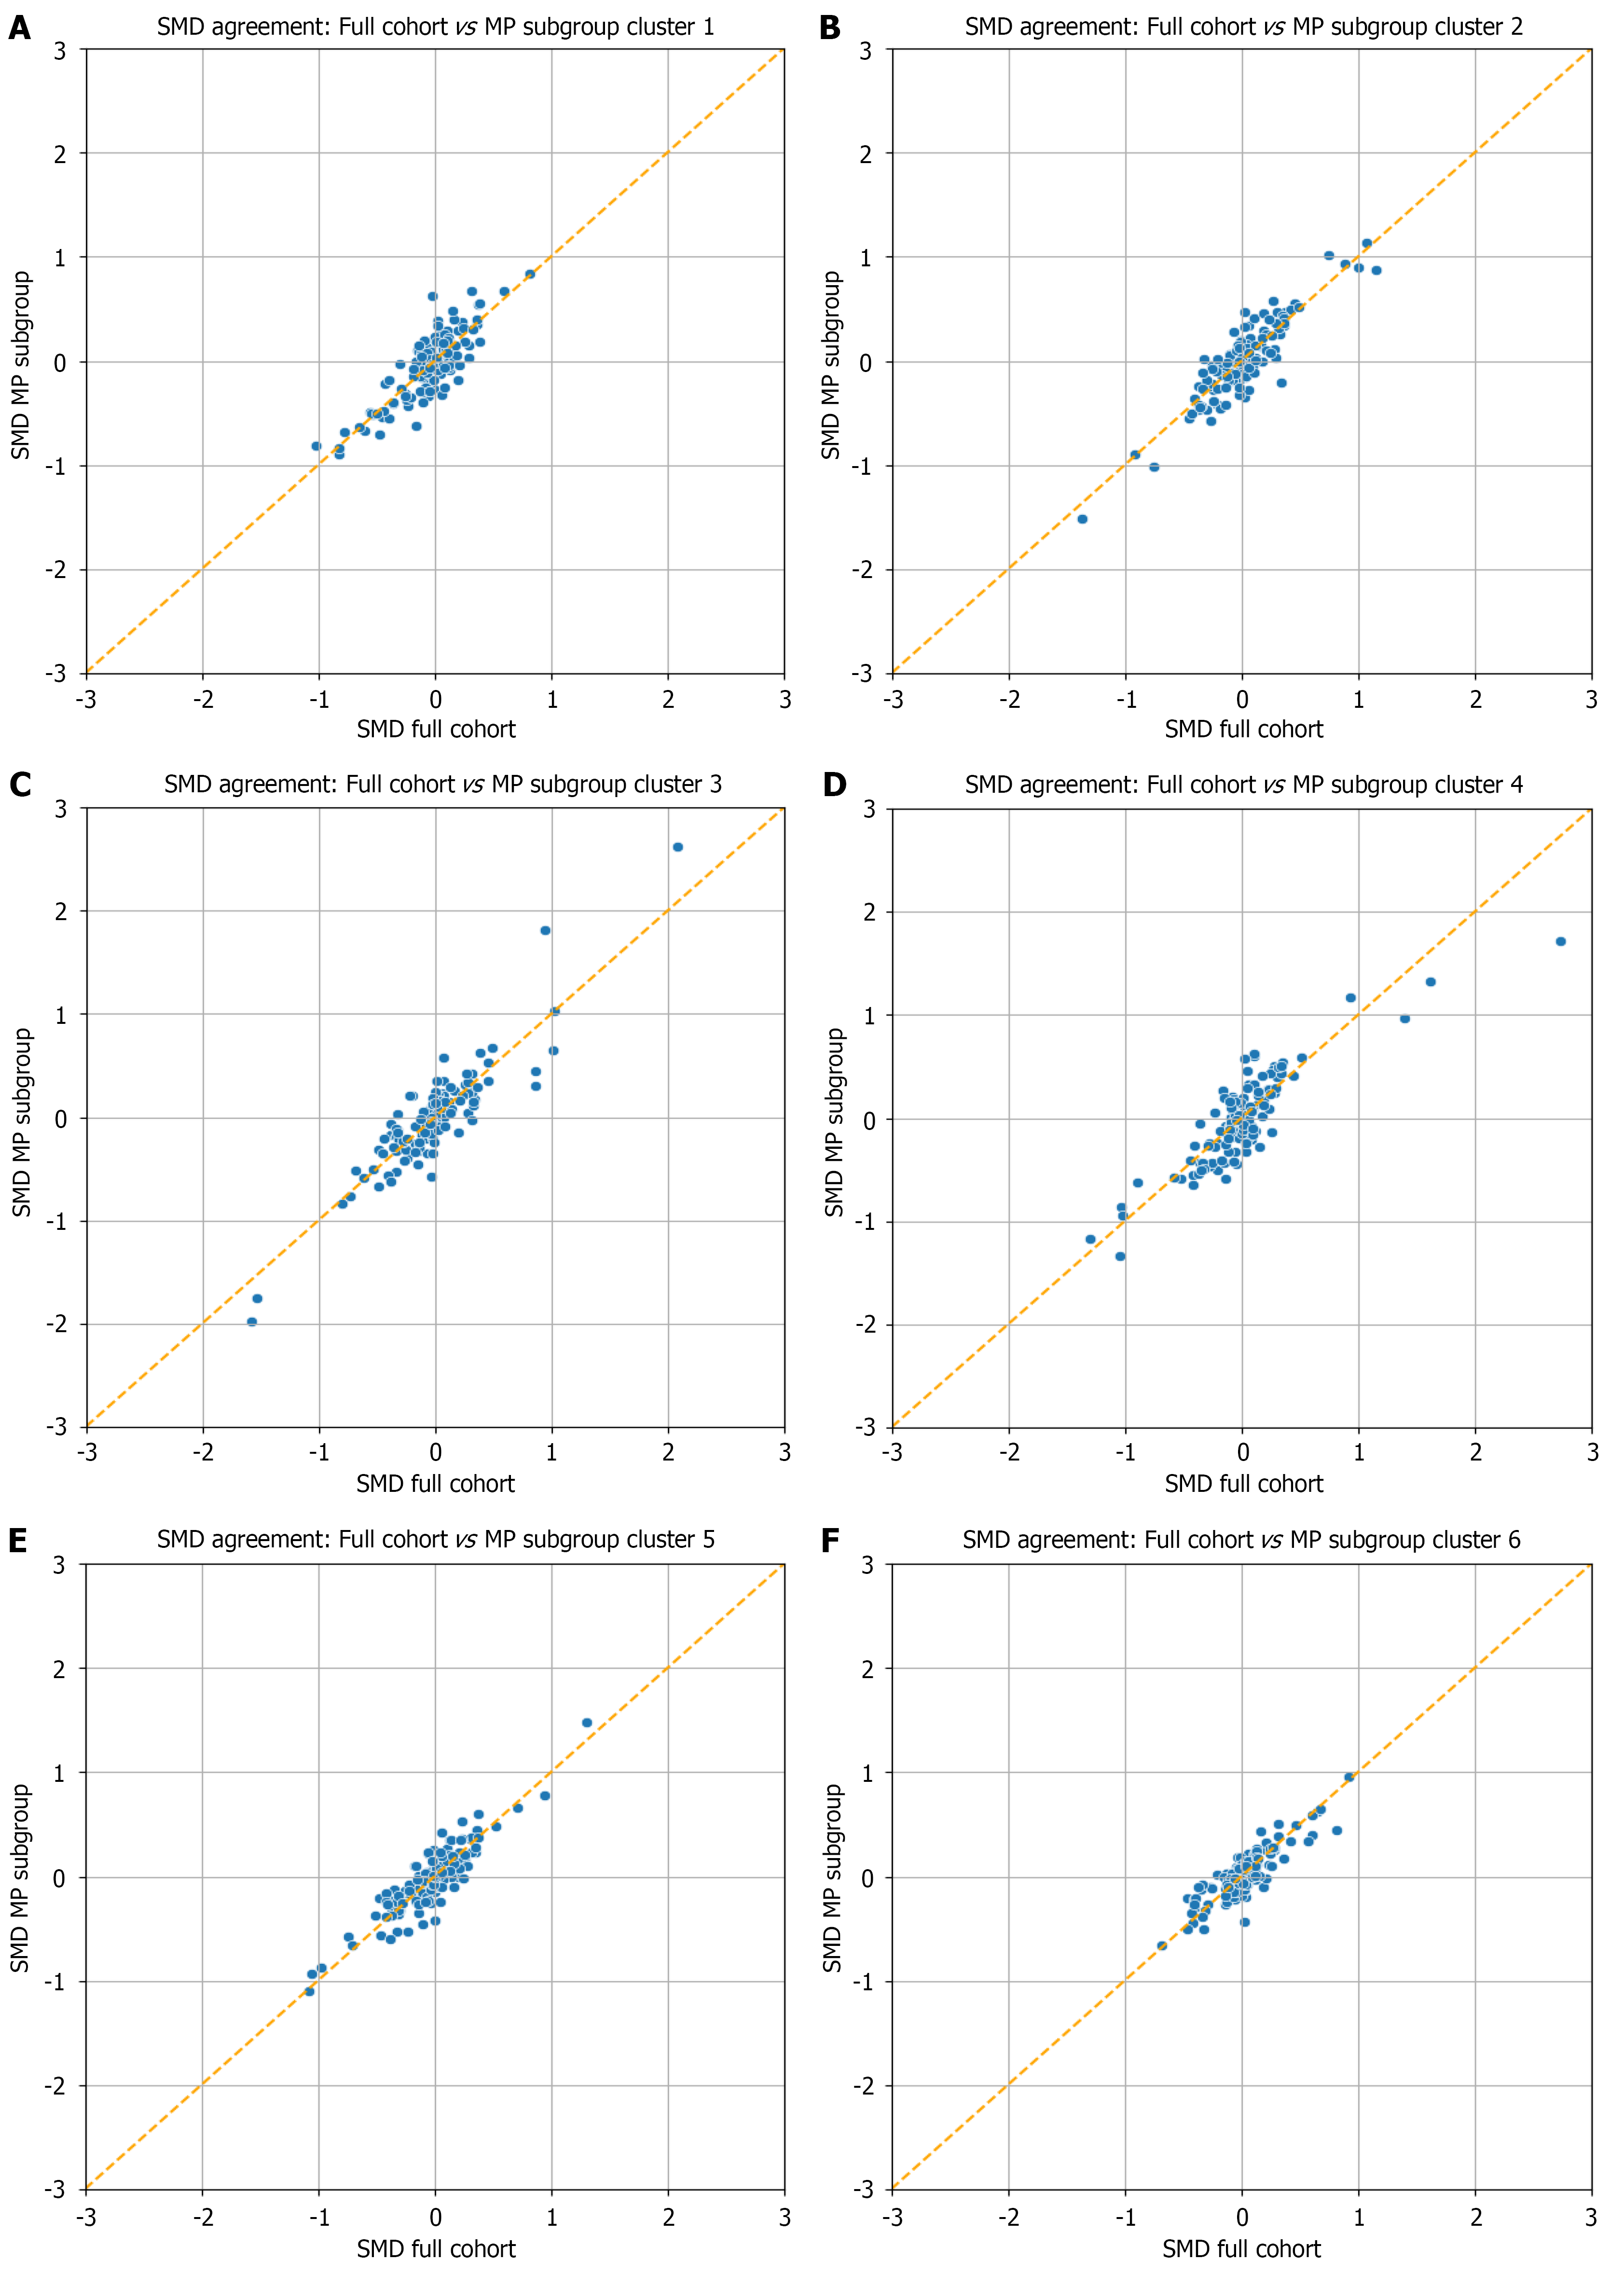
Figure 7 Cross-dataset Standardized mean difference profile agreement between matched clusters.
Scatter plots comparing standardized mean difference (SMD) profiles between corresponding clusters in the full cohort (X-axis) and machine perfusion subgroup (Y-axis) for cluster 1, cluster 2, cluster luster 3, cluster luster 4, cluster luster 5, and cluster luster 6 each point represents a single clinical feature’s SMD value in the matched cluster pair. Optimal cluster correspondence between datasets was determined using the Hungarian algorithm to maximize phenotypic similarity based on SMD profiles. The orange dashed line (Y = X) represents perfect agreement. Points closer to this line indicate consistent feature effect sizes across datasets, while deviations suggest differential phenotypic patterns. Phenotypic alignment was quantified using Pearson correlation coefficients and mean absolute differences between matched SMD profiles. A: Cluster 1; B: Cluster 2; C: Cluster 3; D: Cluster 4; E: Cluster 5; F: Cluster 6. MP: Machine perfusion; SMD: Standardized mean difference.
- Citation: Castellanos De Brigard J, Rangganata E, Papalois VE. Machine perfusion distribution across clinical phenotypes in kidney transplantation: A national cohort study using unsupervised clustering. World J Transplant 2026; 16(3): 121821
- URL: https://www.wjgnet.com/2220-3230/full/v16/i3/121821.htm
- DOI: https://dx.doi.org/10.5500/wjt.121821