
















Copyright: ©Author(s) 2026.
World J Transplant. Sep 18, 2026; 16(3): 121821
Published online Sep 18, 2026. doi: 10.5500/wjt.121821
Published online Sep 18, 2026. doi: 10.5500/wjt.121821
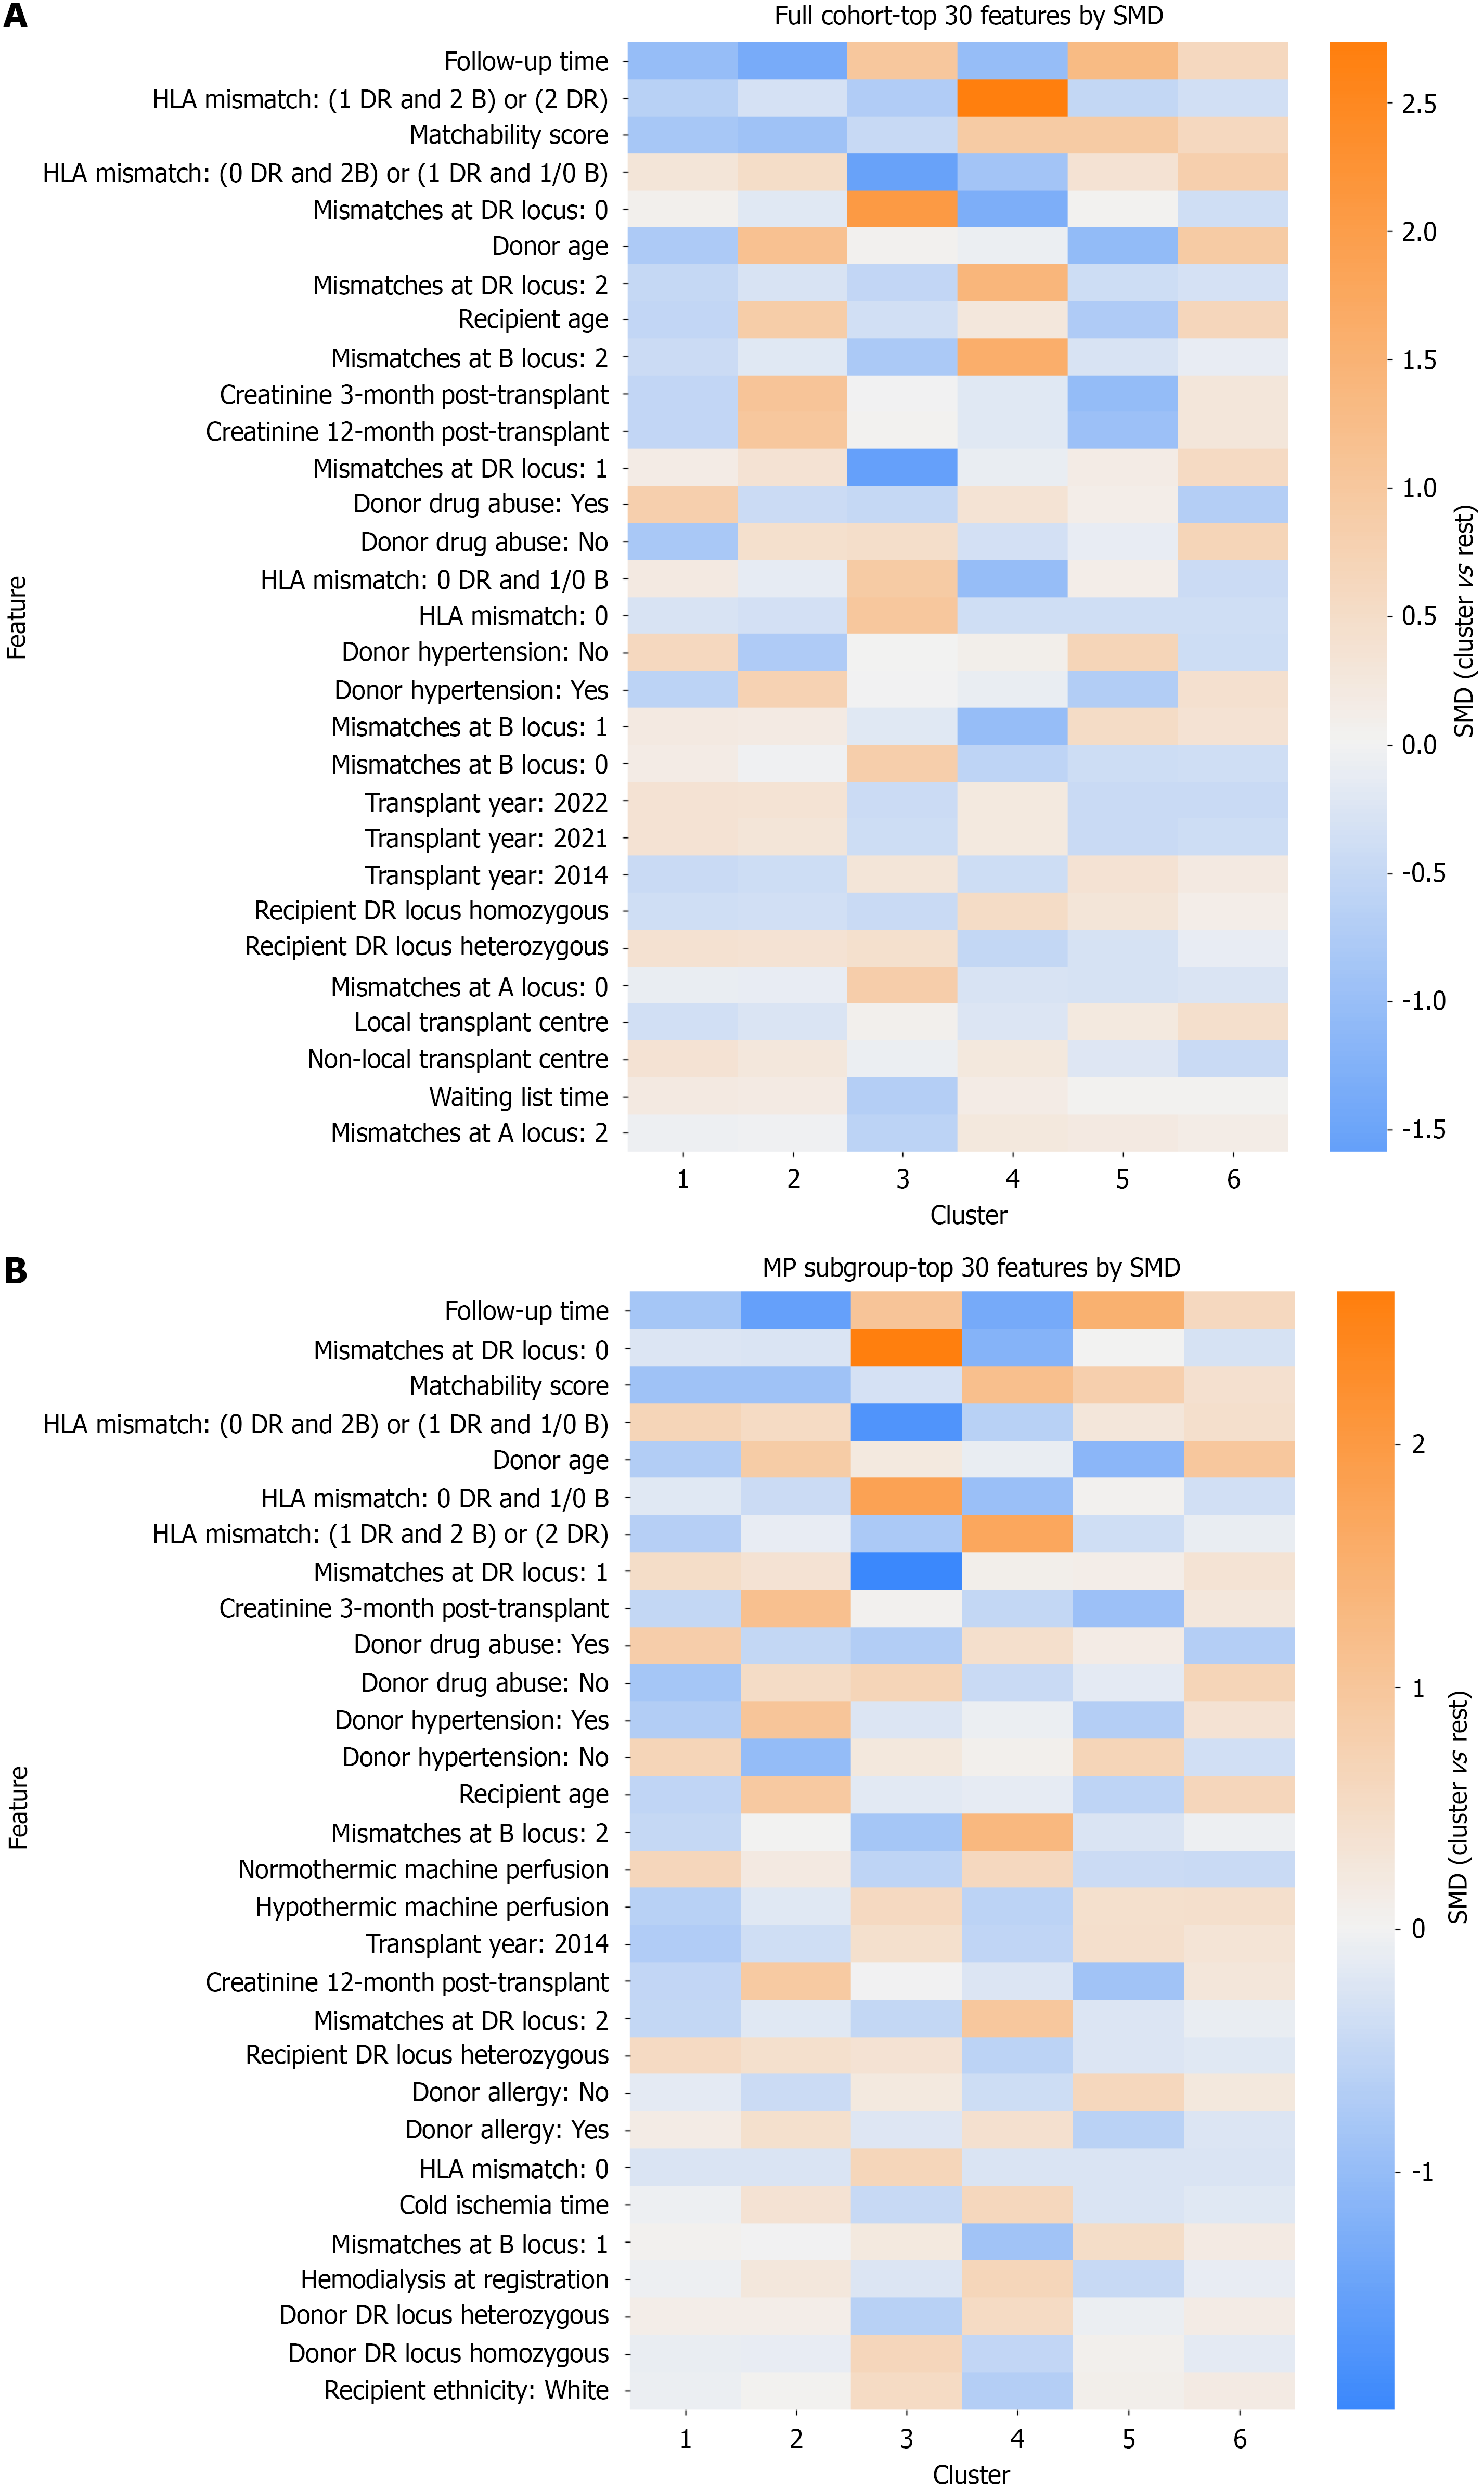
Figure 6 Standardized mean difference heatmaps for cluster characterization.
Heatmaps displaying the top 30 clinical features with the largest absolute standardized mean difference (SMD) across clusters for the full cohort (n = 15904) and the machine perfusion subgroup (n = 544). Features include demographic, clinical, and transplant-related variables from both donors and recipients, ranked from top to bottom by maximum absolute SMD across all clusters. Each cell represents the SMD of a given feature in one cluster compared to all other clusters combined. The color scale ranges from blue (negative SMD, feature value lower than average) through white (SMD approximately 0) to orange (positive SMD, feature value higher than average). Columns represent the six patient clusters; rows represent individual features. SMD values ≥ 0.3 or ≤ -0.3 are generally considered clinically meaningful differences. A: The full cohort; B: The machine perfusion subgroup. SMD: Standardized mean difference; HLA: Human leukocyte antigen; MP: Machine perfusion.
- Citation: Castellanos De Brigard J, Rangganata E, Papalois VE. Machine perfusion distribution across clinical phenotypes in kidney transplantation: A national cohort study using unsupervised clustering. World J Transplant 2026; 16(3): 121821
- URL: https://www.wjgnet.com/2220-3230/full/v16/i3/121821.htm
- DOI: https://dx.doi.org/10.5500/wjt.121821