
















Copyright: ©Author(s) 2026.
World J Transplant. Sep 18, 2026; 16(3): 121821
Published online Sep 18, 2026. doi: 10.5500/wjt.121821
Published online Sep 18, 2026. doi: 10.5500/wjt.121821
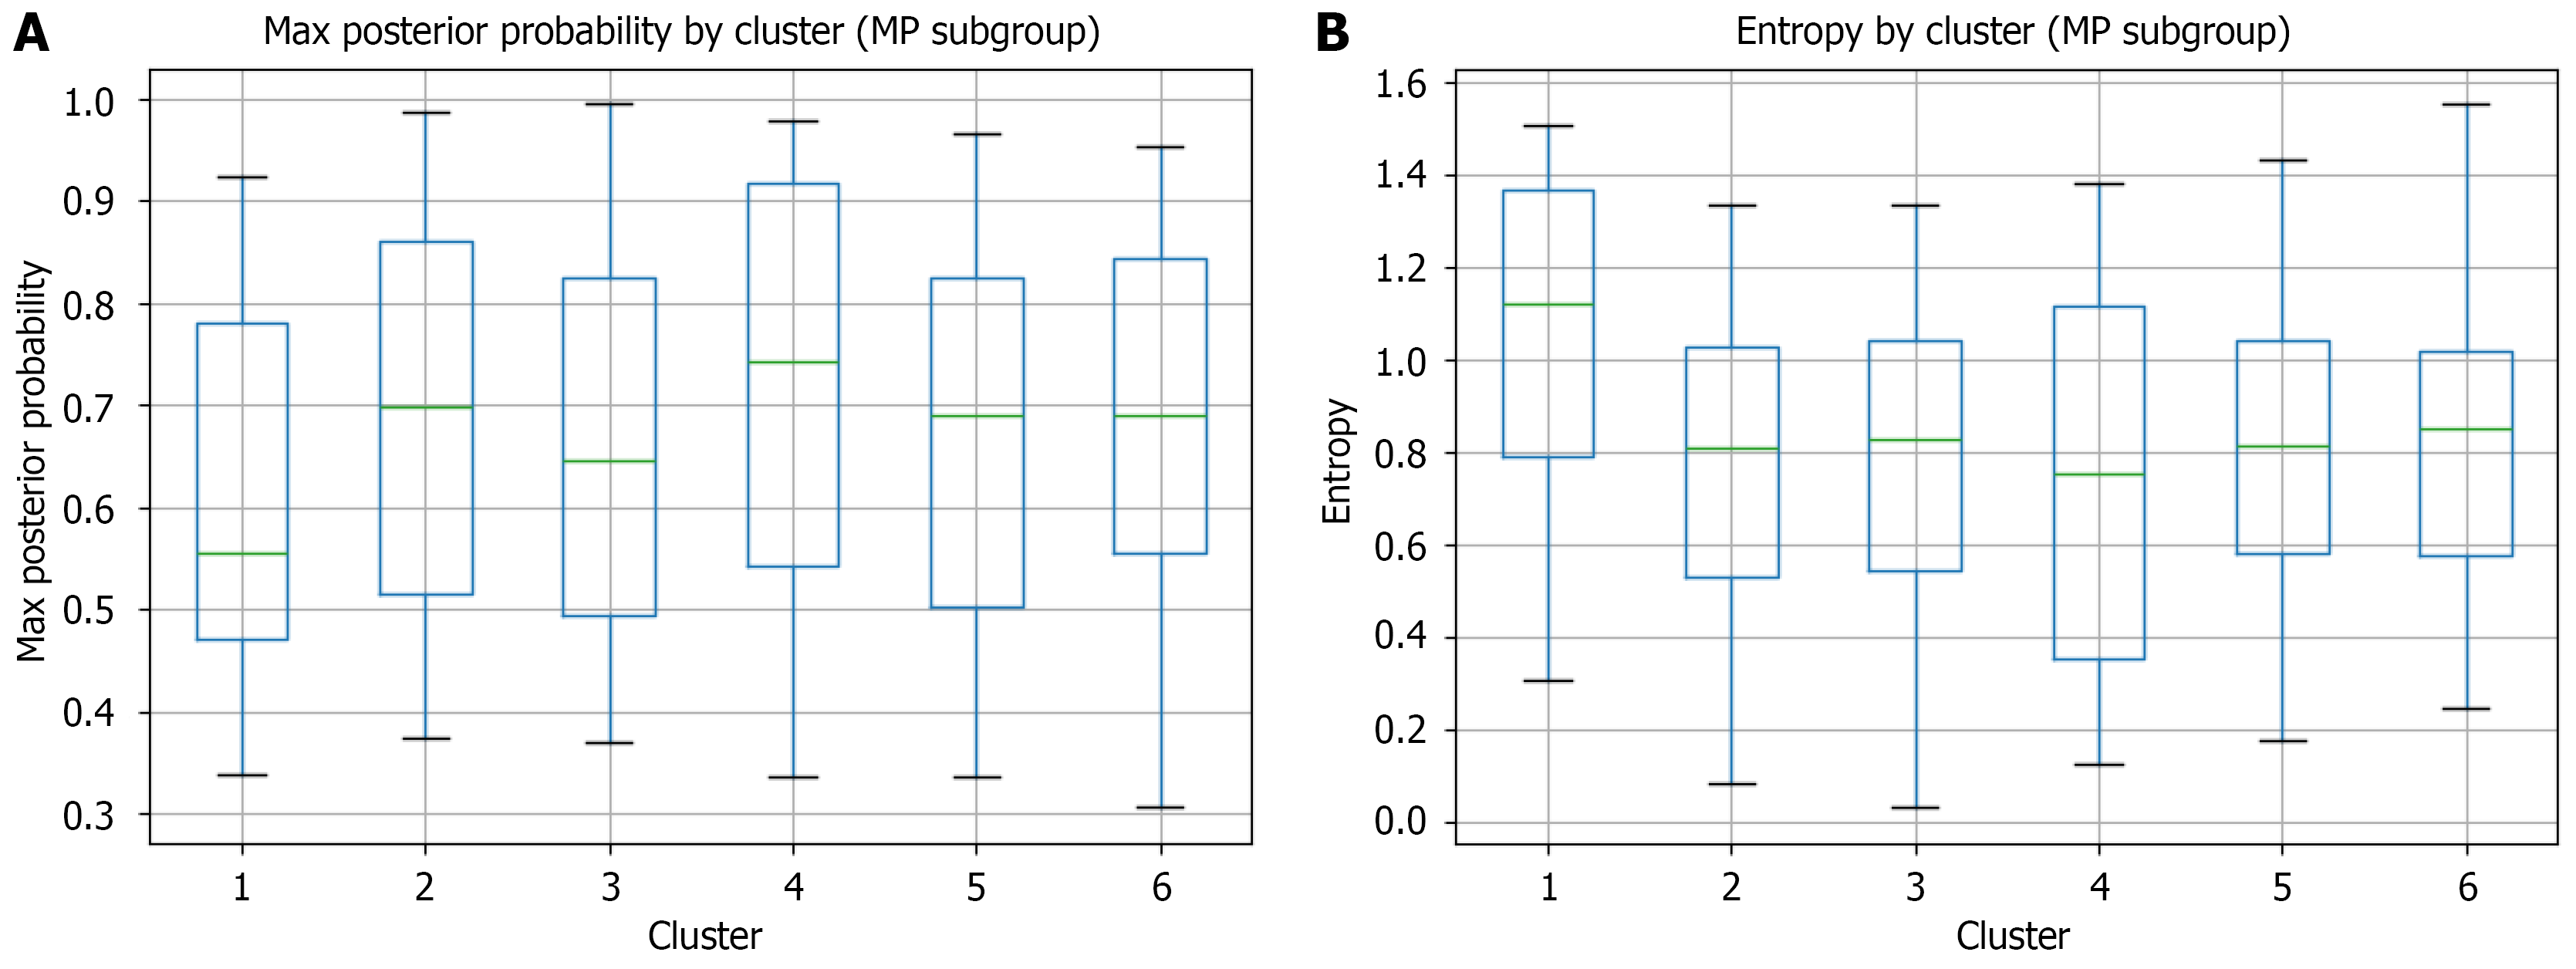
Figure 5 Cluster membership uncertainty assessed by maximum posterior probability and Shannon entropy in the machine perfusion subgroup.
A: Boxplots showing the distribution of maximum posterior probability for each of the six patient clusters identified by gaussian mixture model. Maximum posterior probability represents each patient’s confidence of assignment to their designated cluster, with values closer to 1 indicating higher certainty. Box boundaries represent the 25th and 75th percentiles, horizontal lines indicate medians, and whiskers extend to 1.5 × the interquartile range; B: Boxplots showing the distribution of Shannon entropy of the full posterior distribution for each cluster. Entropy quantifies assignment uncertainty, with lower values indicating more confident cluster membership. Cluster 4 demonstrates the highest membership confidence also in the machine perfusion subgroup (median max probability = 0.74, median entropy = 0.72), while cluster 1 shows greater uncertainty (median max probability = 0.55, median entropy = 1.11). MP: Machine perfusion.
- Citation: Castellanos De Brigard J, Rangganata E, Papalois VE. Machine perfusion distribution across clinical phenotypes in kidney transplantation: A national cohort study using unsupervised clustering. World J Transplant 2026; 16(3): 121821
- URL: https://www.wjgnet.com/2220-3230/full/v16/i3/121821.htm
- DOI: https://dx.doi.org/10.5500/wjt.121821