
















Copyright: ©Author(s) 2026.
World J Transplant. Sep 18, 2026; 16(3): 121821
Published online Sep 18, 2026. doi: 10.5500/wjt.121821
Published online Sep 18, 2026. doi: 10.5500/wjt.121821
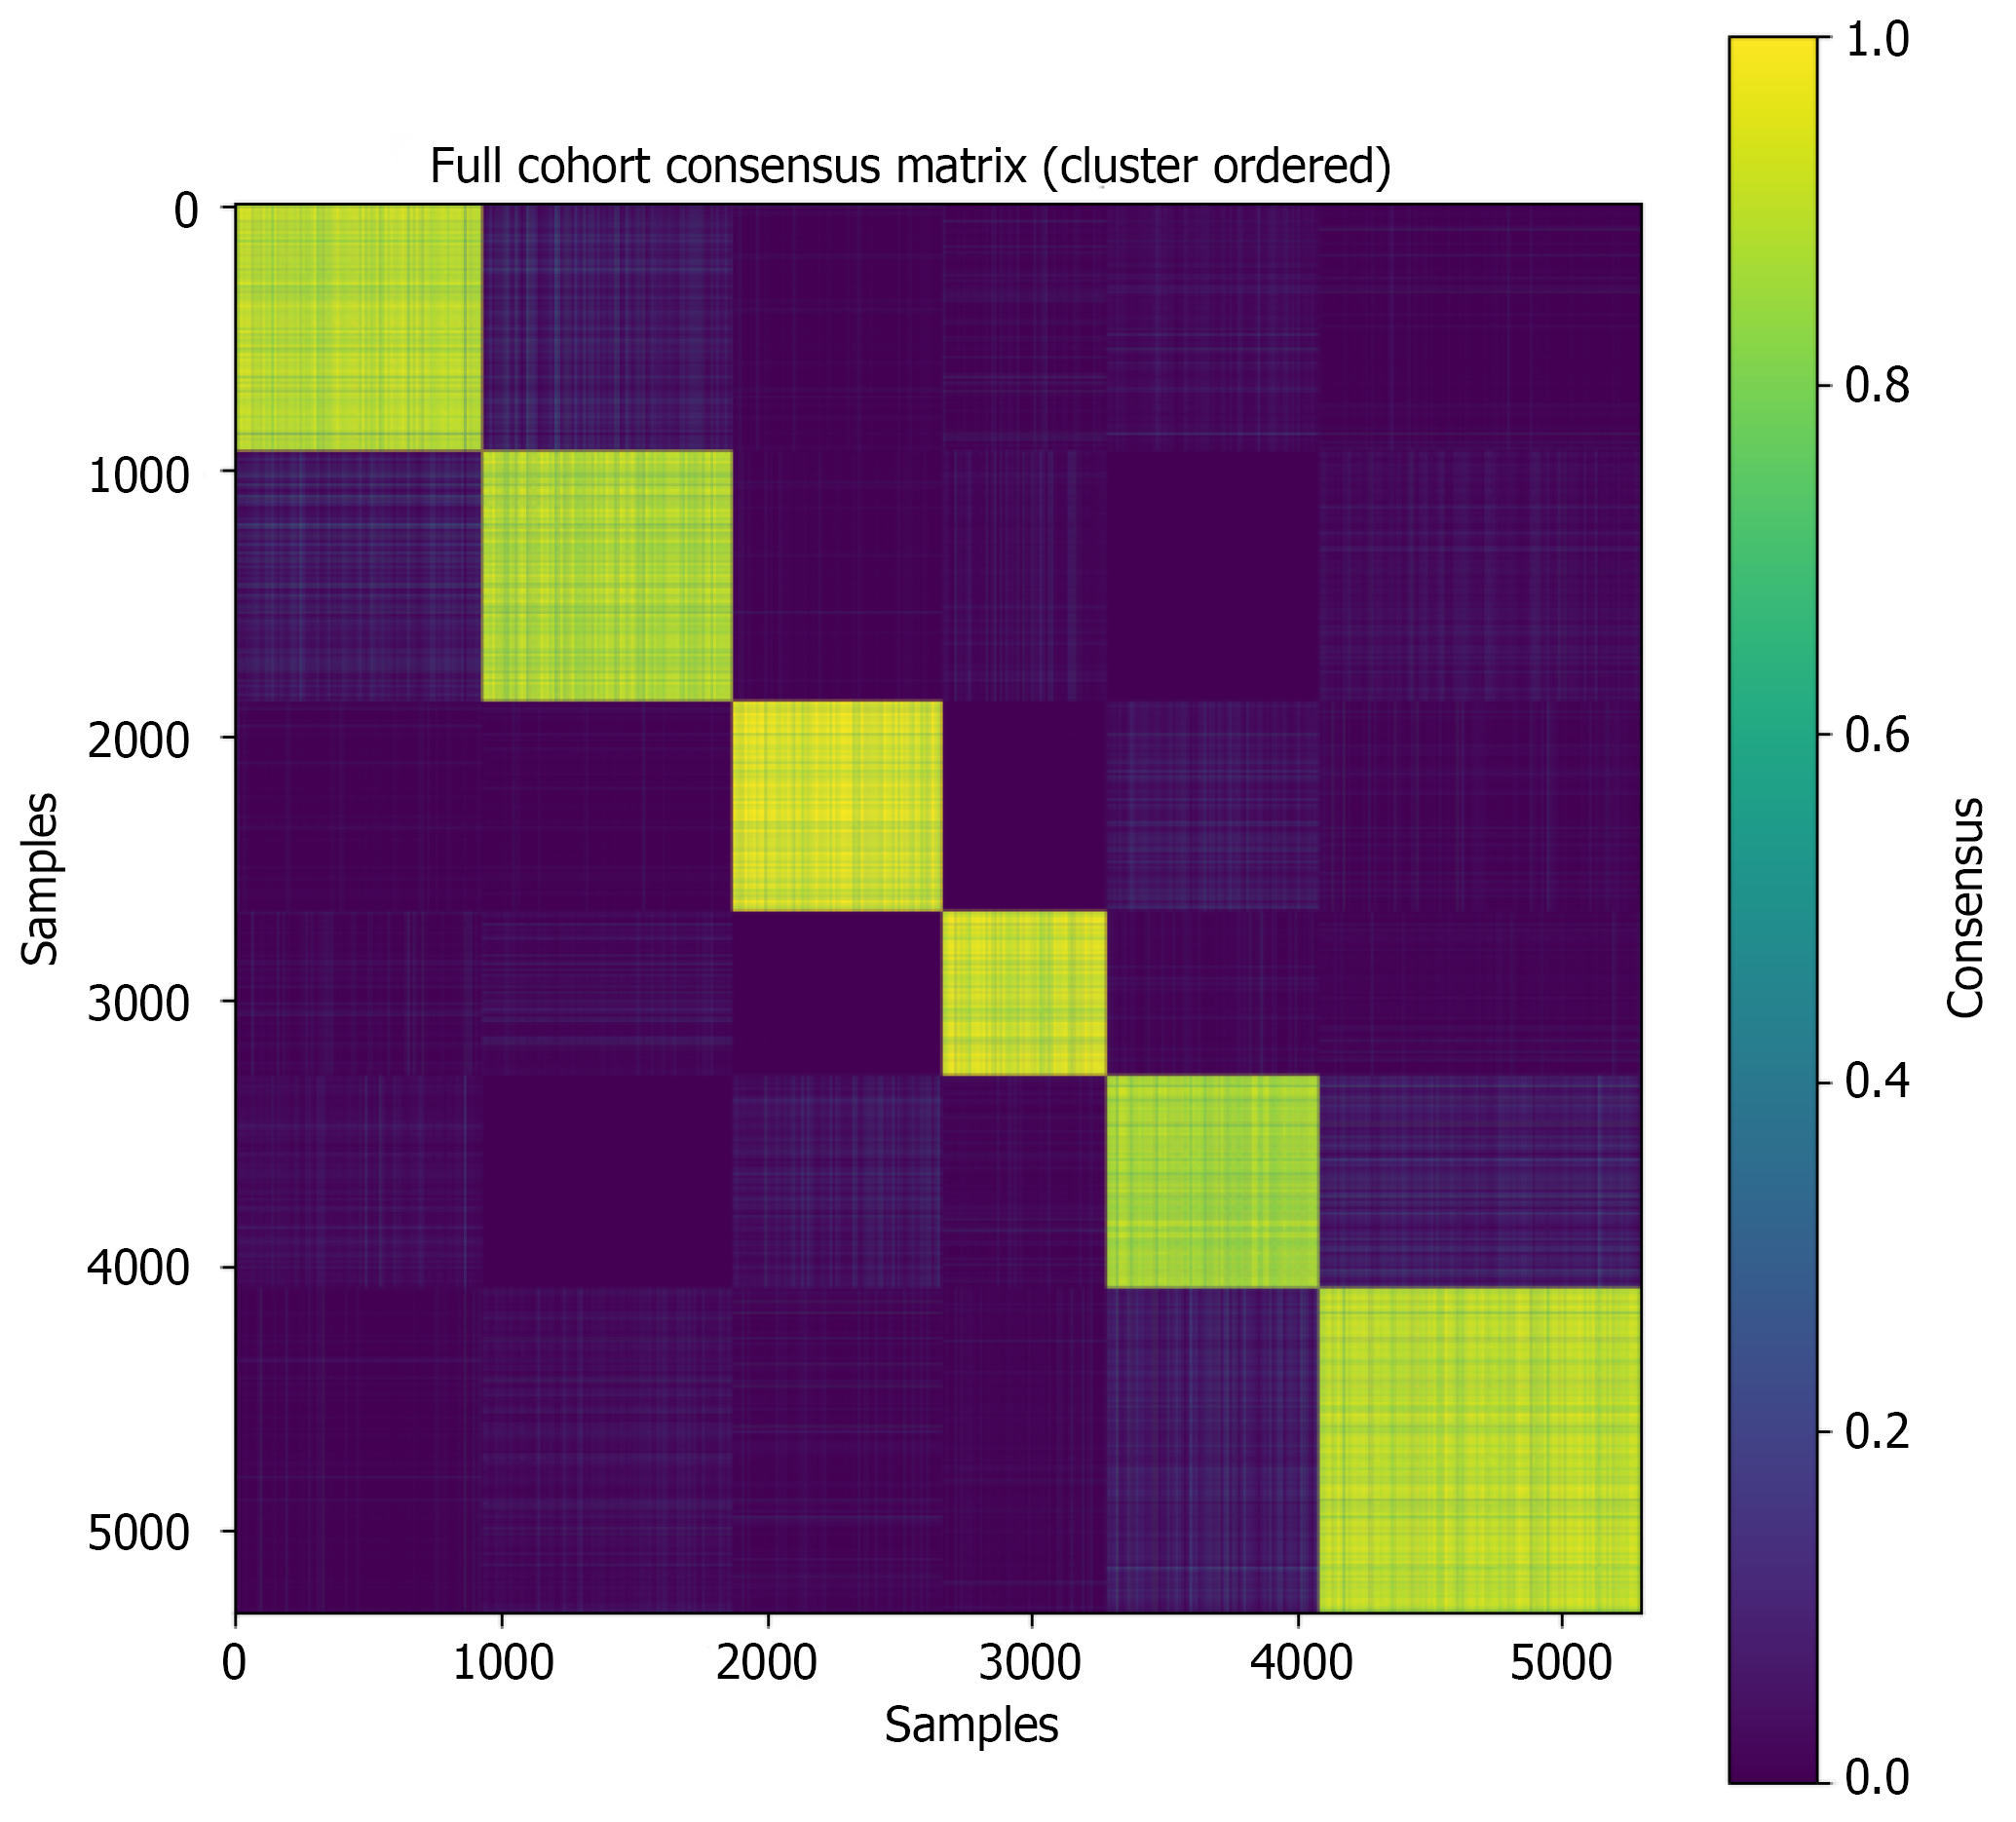
Figure 3 Full cohort cluster stability consensus matrix.
Consensus clustering matrix for the full cohort based on 100 iterations with 80% subsampling. Each cell represents the proportion of times a pair of samples was assigned to the same cluster across resampled runs. Samples are ordered by cluster membership, with blocks along the diagonal indicating stable clusters. Higher values (yellow) reflect more consistent co-clustering, whereas diffuse or intermediate values indicate instability (dark purple). Clusters are ordered from left to right (first on the left cluster 1, last on the right cluster 6).
- Citation: Castellanos De Brigard J, Rangganata E, Papalois VE. Machine perfusion distribution across clinical phenotypes in kidney transplantation: A national cohort study using unsupervised clustering. World J Transplant 2026; 16(3): 121821
- URL: https://www.wjgnet.com/2220-3230/full/v16/i3/121821.htm
- DOI: https://dx.doi.org/10.5500/wjt.121821