
















Copyright: ©Author(s) 2026.
World J Transplant. Sep 18, 2026; 16(3): 121821
Published online Sep 18, 2026. doi: 10.5500/wjt.121821
Published online Sep 18, 2026. doi: 10.5500/wjt.121821
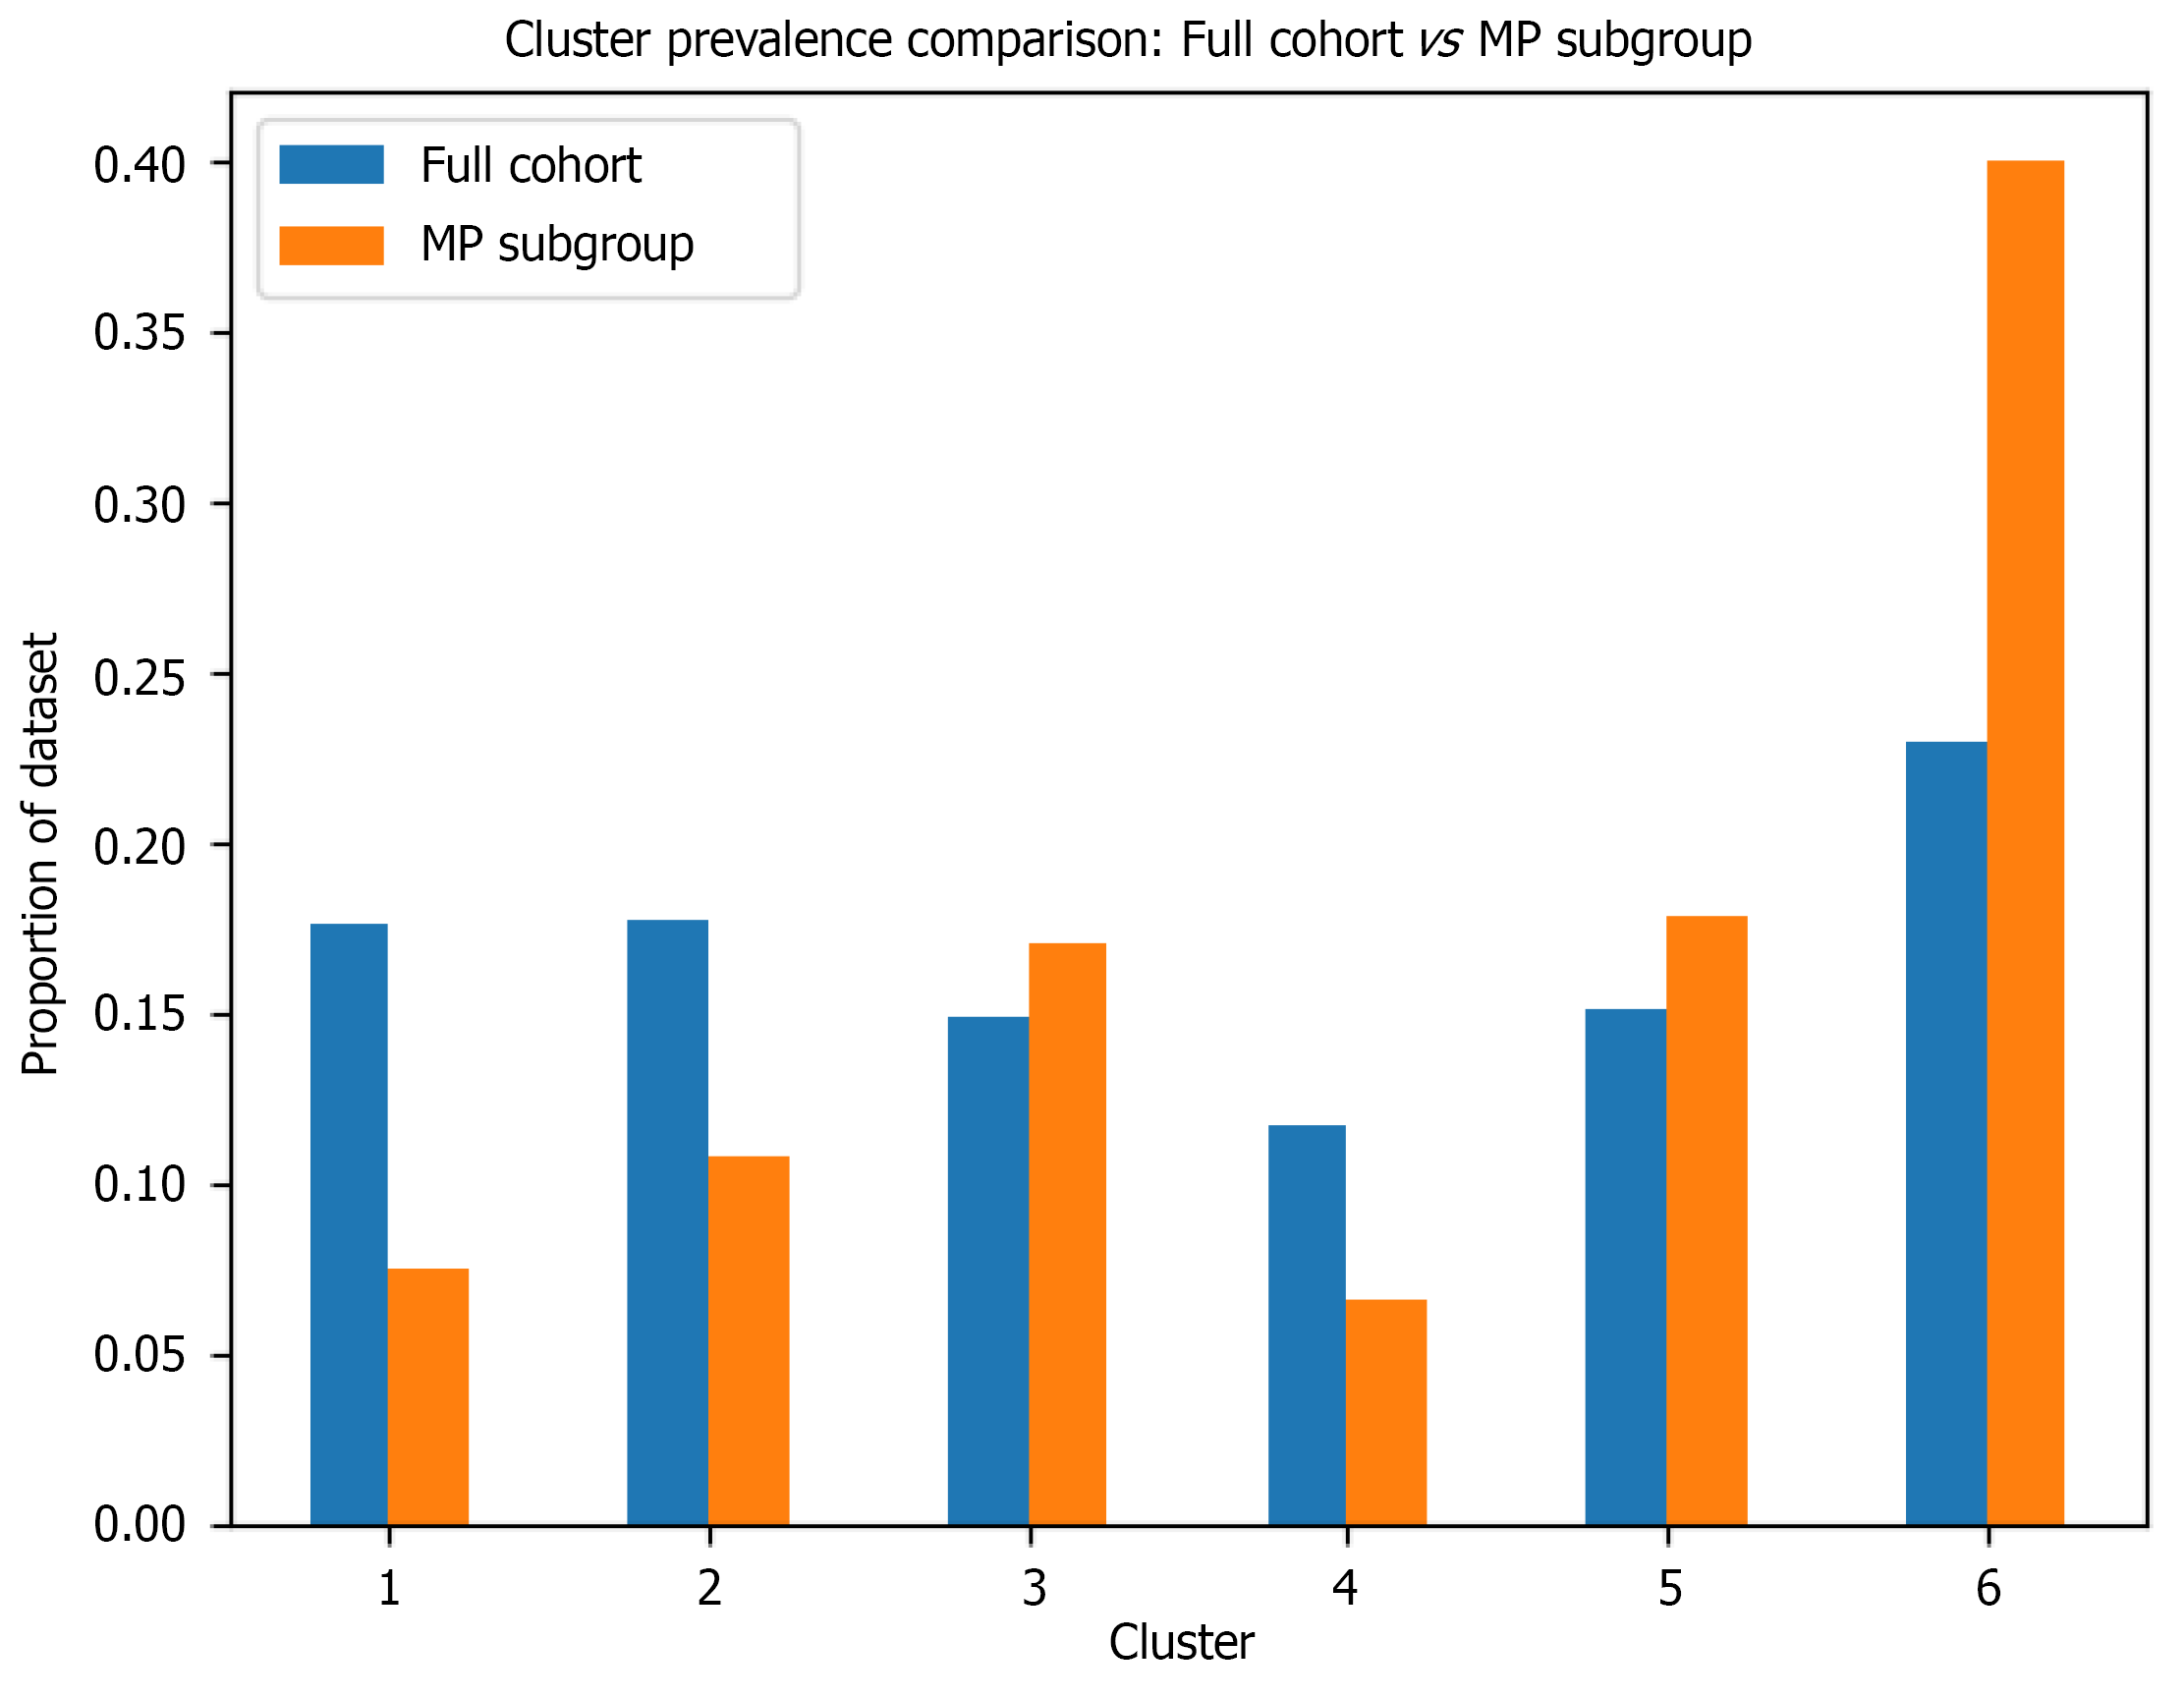
Figure 2 Cluster samples distribution comparison between the full cohort (n = 15904) and the machine perfusion subgroup (n = 544).
The machine perfusion (MP) subgroup shows notable enrichment in cluster 6 (40.0% vs 22.9% in full cohort) and cluster 5 (17.8% vs 15.1%), with corresponding under-representation in clusters 1 (7.5% vs 17.5%) and 4 (6.6% vs 11.6%). Cluster distribution in the full cohort: Cluster 1 n = 2797 (17.5%), cluster 2 n = 2826 (17.7%), cluster 3 n = 2370 (14.9%), cluster 4 n = 1854 (11.6%), cluster 5 n = 2402 (15.1%), cluster 6 n = 3655 (22.9%); In the MP subgroup: Cluster 1 n = 41 (7.5%), cluster 2 n = 59 (10.8%), cluster 3 n = 93 (17.0%), cluster 4 n = 36 (6.6%), cluster 5 n = 97 (17.8%), cluster 6 n = 218 (40.0%). MP: Machine perfusion.
- Citation: Castellanos De Brigard J, Rangganata E, Papalois VE. Machine perfusion distribution across clinical phenotypes in kidney transplantation: A national cohort study using unsupervised clustering. World J Transplant 2026; 16(3): 121821
- URL: https://www.wjgnet.com/2220-3230/full/v16/i3/121821.htm
- DOI: https://dx.doi.org/10.5500/wjt.121821