
















Copyright: ©Author(s) 2026.
World J Transplant. Sep 18, 2026; 16(3): 121821
Published online Sep 18, 2026. doi: 10.5500/wjt.121821
Published online Sep 18, 2026. doi: 10.5500/wjt.121821
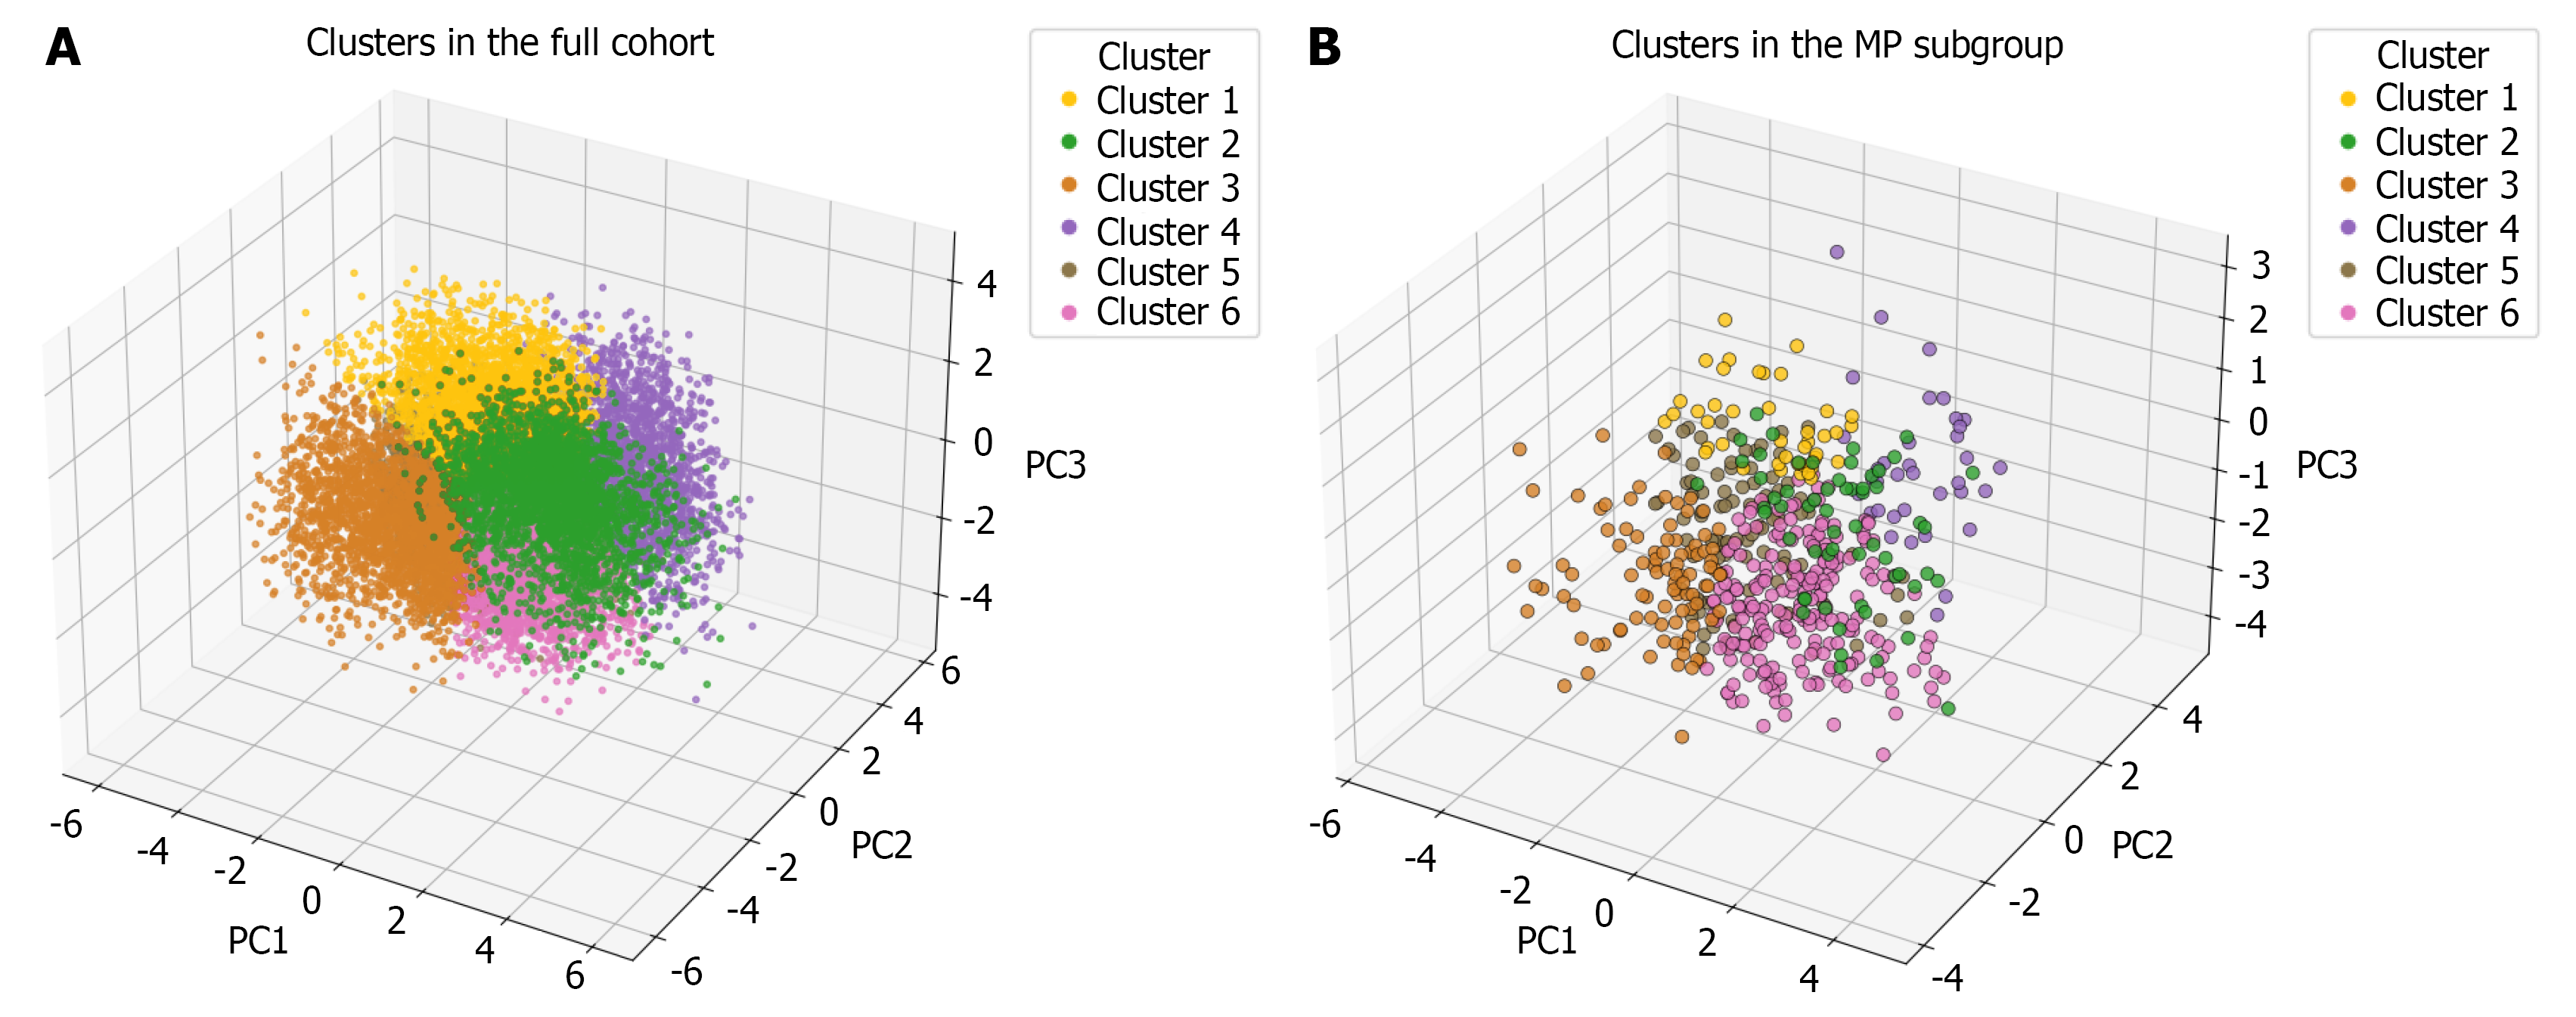
Figure 1 Resulting clusters in the full cohort and the machine perfusion subgroup.
A and B: 3D visualisation of clustering results from weighted principal component analysis for mixed-type data followed by gaussian mixture model in the full cohort (A) and machine perfusion subgroup (B). Points represent individuals projected onto the first three principal components (PC1–PC3), with colours indicating gaussian mixture model-derived cluster membership. MP: Machine perfusion.
- Citation: Castellanos De Brigard J, Rangganata E, Papalois VE. Machine perfusion distribution across clinical phenotypes in kidney transplantation: A national cohort study using unsupervised clustering. World J Transplant 2026; 16(3): 121821
- URL: https://www.wjgnet.com/2220-3230/full/v16/i3/121821.htm
- DOI: https://dx.doi.org/10.5500/wjt.121821