
















Copyright: ©Author(s) 2026.
World J Transplant. Sep 18, 2026; 16(3): 121567
Published online Sep 18, 2026. doi: 10.5500/wjt.121567
Published online Sep 18, 2026. doi: 10.5500/wjt.121567
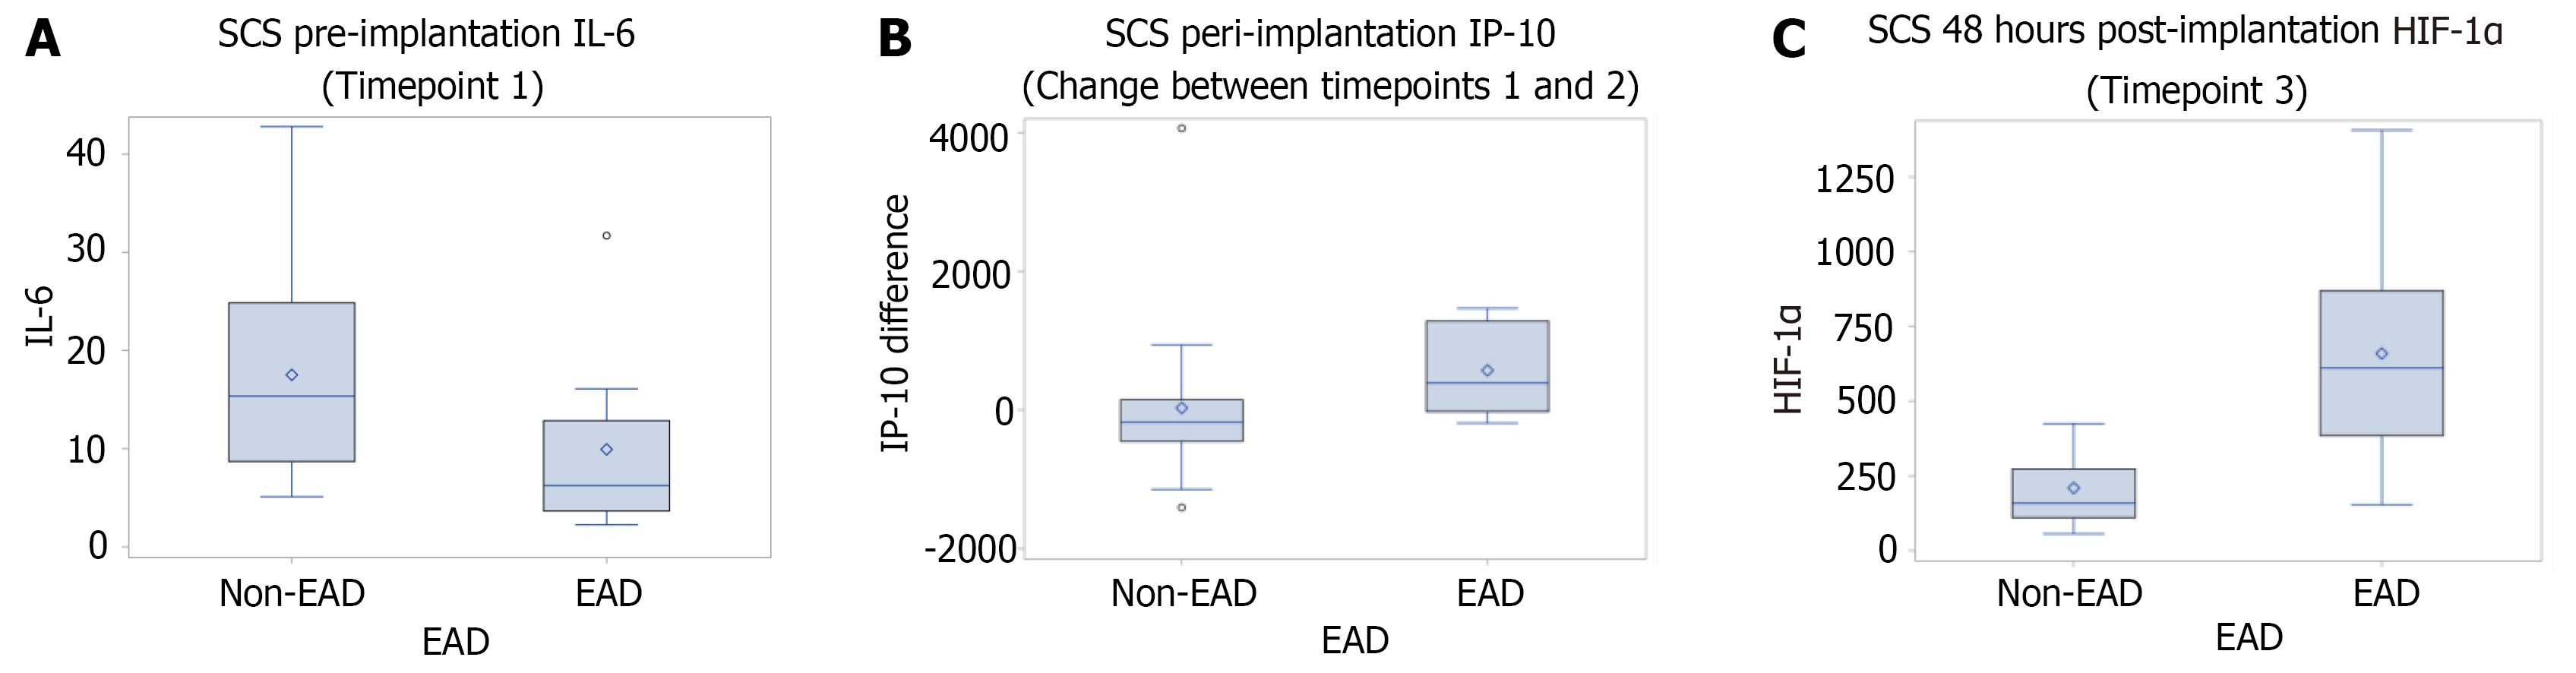
Figure 1 Boxplots comparing levels of each statistically significant biomarker at its corresponding timepoint.
A: Interleukin-6 at T1 (baseline), P = 0.0433; B: Peri-implantation interferon-gamma-inducible protein 10 (T2-T1), P = 0.02; C: Hypoxia inducible factor-1 alpha at T3 (48 hours post-implantation), P = 0.0095, between non-early allograft dysfunction (EAD) and EAD groups. HIF-1α: Hypoxia inducible factor-1 alpha; IL-6: Interleukin-6; IP-10: Interferon-gamma-inducible protein 10; SCS: Static cold storage.
- Citation: Wilson EA, Rashied A, Privratsky JR, Serbanescu M, Barbas AS, Williams KM, Coopersmith CM. Predictive biomarkers of early allograft dysfunction after liver transplantation: A prospective pilot study. World J Transplant 2026; 16(3): 121567
- URL: https://www.wjgnet.com/2220-3230/full/v16/i3/121567.htm
- DOI: https://dx.doi.org/10.5500/wjt.121567