
















Copyright: ©Author(s) 2026.
World J Transplant. Sep 18, 2026; 16(3): 119505
Published online Sep 18, 2026. doi: 10.5500/wjt.119505
Published online Sep 18, 2026. doi: 10.5500/wjt.119505
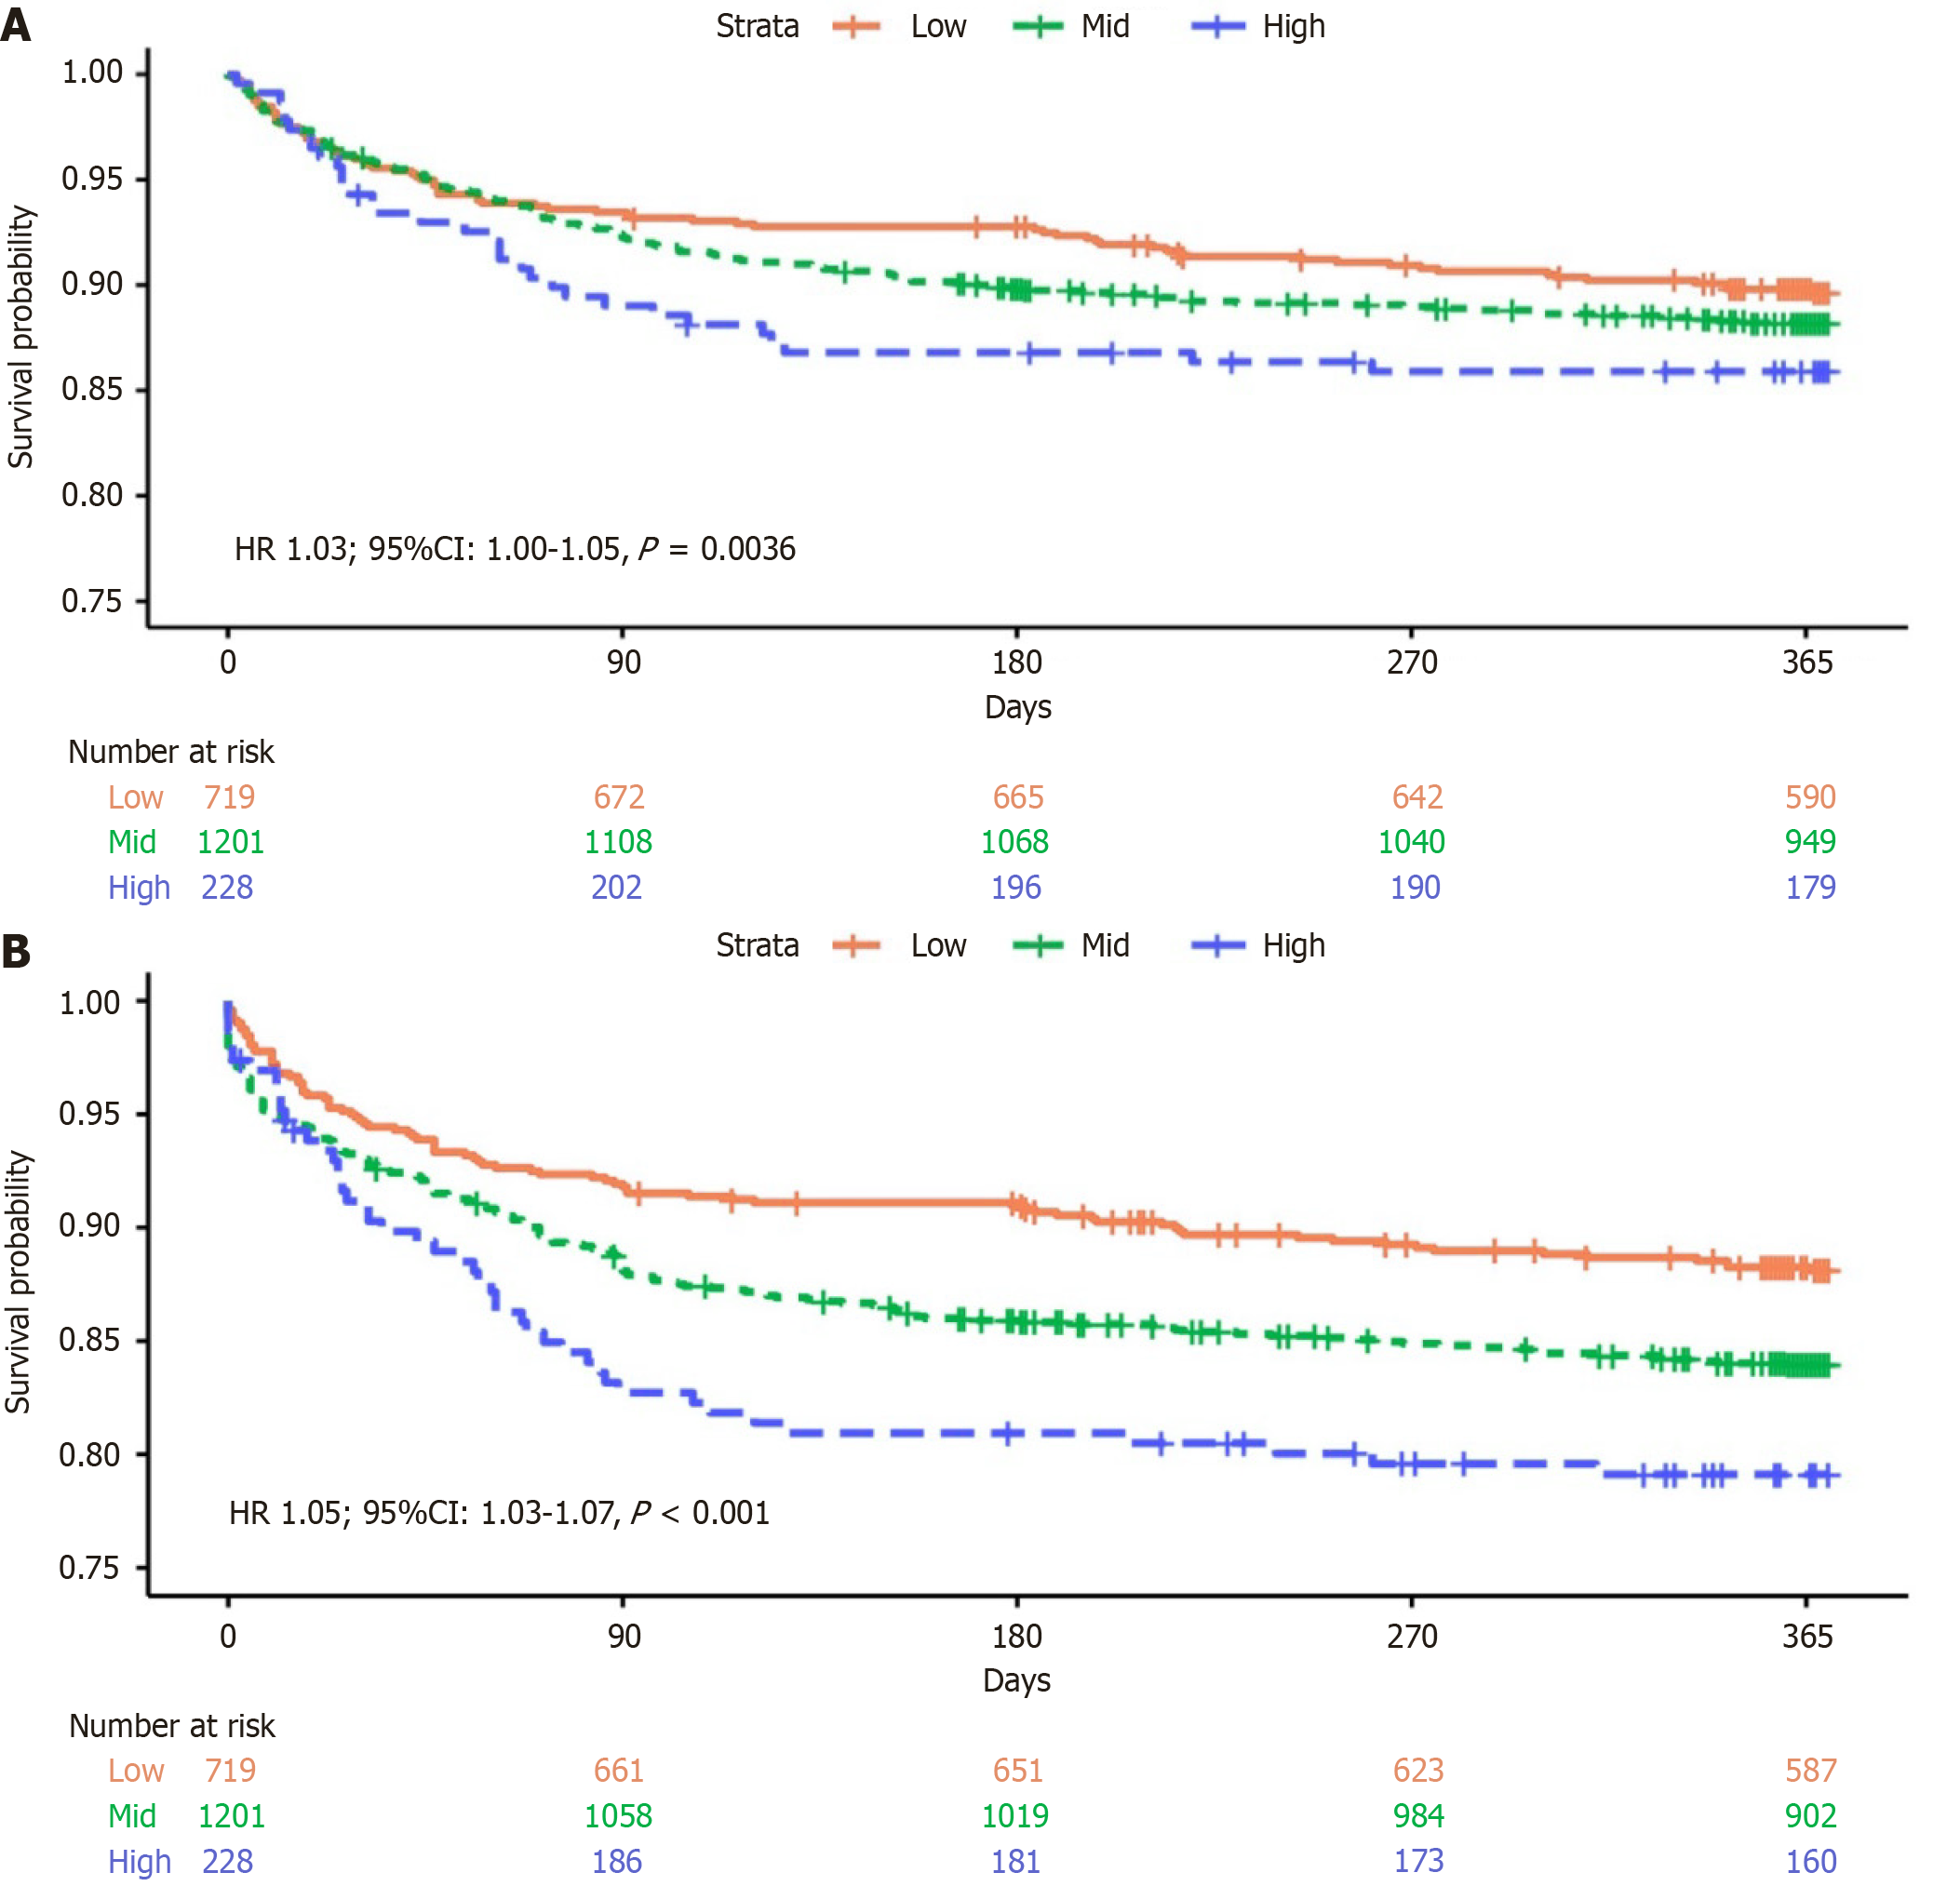
Figure 1 Kaplan–Meier survival curves.
A: By model for end-stage liver disease excluding international normalized ratio (MELD-XI) tertiles. Kaplan-Meier curves for 1-year overall survival stratified by MELD-XI tertiles (low, mid, high) among simultaneous heart–kidney transplant recipients. Higher MELD-XI tertiles were associated with lower survival probabilities. Hazard ratio (HR) for MELD-XI (continuous) was 1.03 (95%CI: 1.00-1.05; P = 0.036). Tick marks represent censored observations; B: 1-year kidney graft survival stratified by MELD-XI tertiles. Kaplan–Meier curves demonstrating kidney graft survival among simultaneous heart–kidney transplant recipients stratified by MELD-XI tertiles (low, mid, and high). Patients in higher MELD-XI tertiles exhibited lower graft survival probabilities over time compared with those in lower tertiles. The HR for MELD-XI as a continuous variable was 1.05 (95%CI: 1.03-1.07; P < 0.001). Tick marks indicate censored observations. Numbers at risk at selected time points are shown below the plot. HR: Hazard ratio; CI: Confidence interval.
- Citation: Diaz-Cordova ME, Rega M, Sharma I, Misawa R, Dhand A, Nishida S, Okumura K. Higher model for end-stage liver disease excluding international normalized ratio scores predict worse kidney graft outcomes in simultaneous heart-kidney transplantation. World J Transplant 2026; 16(3): 119505
- URL: https://www.wjgnet.com/2220-3230/full/v16/i3/119505.htm
- DOI: https://dx.doi.org/10.5500/wjt.119505