
















Copyright: ©Author(s) 2026.
World J Transplant. Jun 18, 2026; 16(2): 118450
Published online Jun 18, 2026. doi: 10.5500/wjt.v16.i2.118450
Published online Jun 18, 2026. doi: 10.5500/wjt.v16.i2.118450
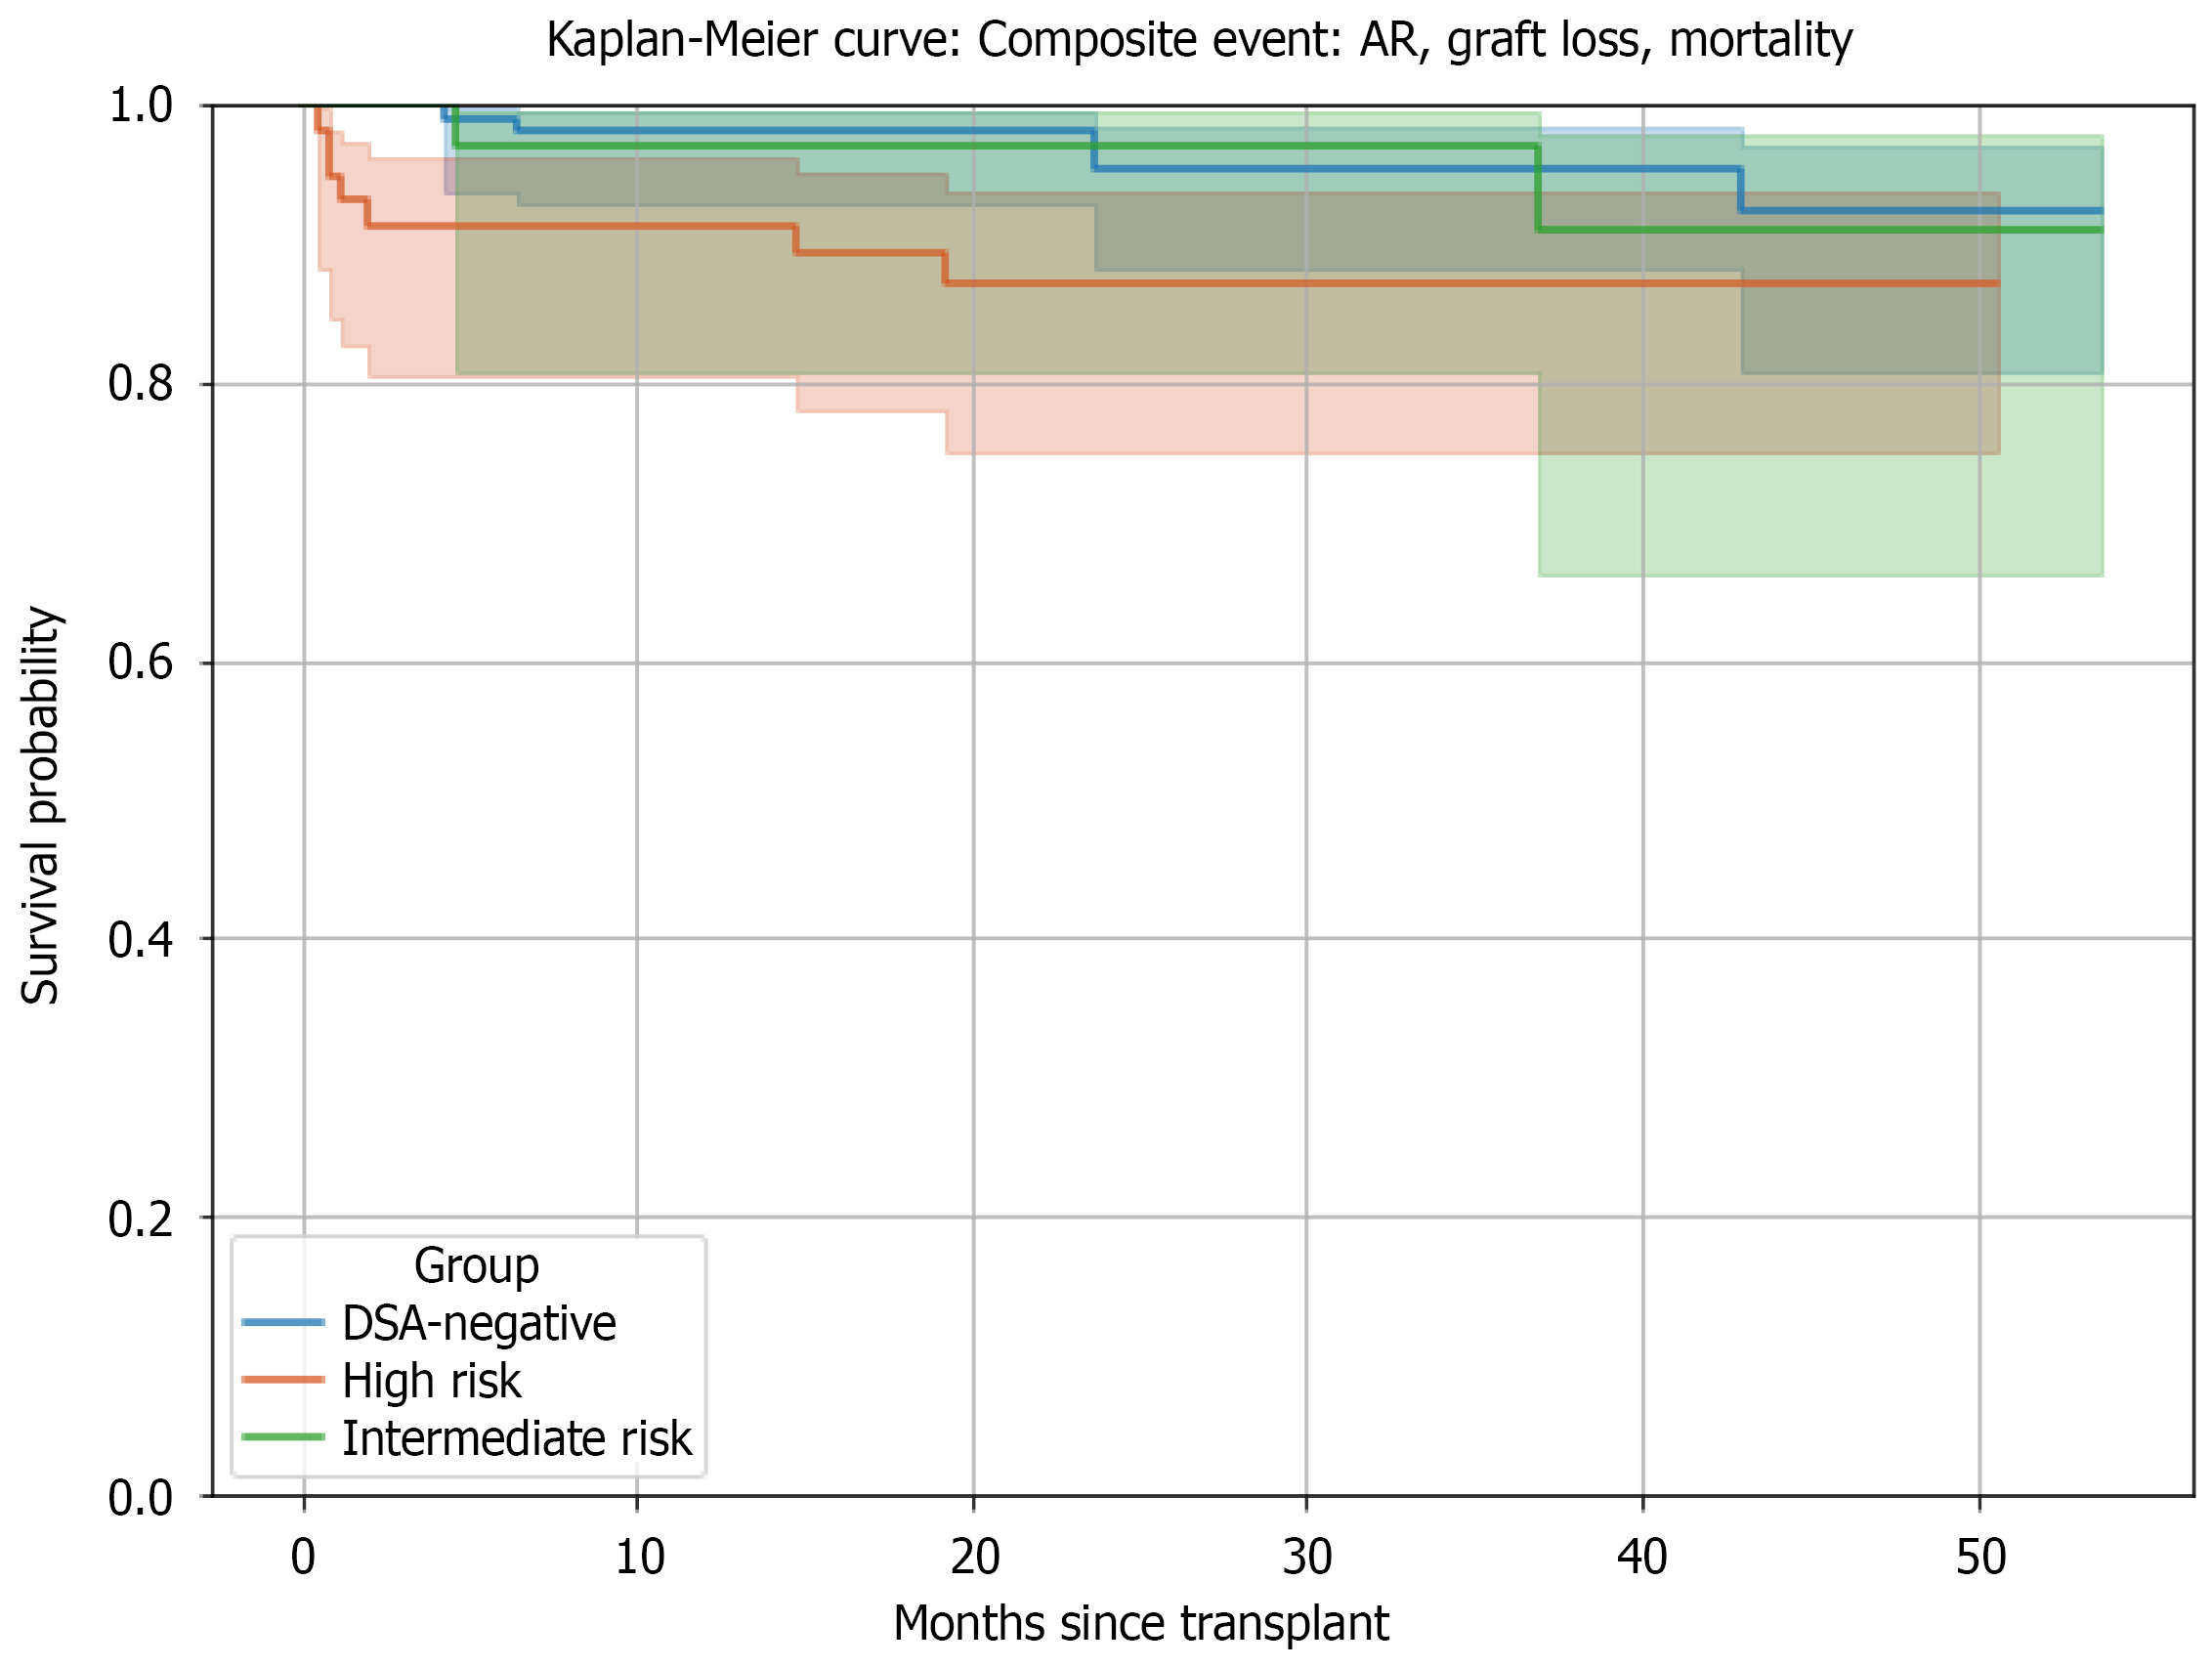
Figure 4 Kaplan-Meier survival curve for composite outcome (acute rejection, graft loss, or mortality) by immunologic risk group.
Kaplan-Meier analysis comparing composite event-free survival among donor-specific antibody -negative, high-risk, and intermediate-risk groups showed a non-significant but suggestive difference (log-rank P = 0.0849). Survival rates appeared lower in the High-Risk group, although this did not reach statistical significance. AR: Acute rejection; DSA: Donor-specific antibody.
- Citation: Al-Qurashi SH, Khalil MAM, Mahmood HHK, Alsharif MM, Alqurashi YF, Alghamdi L, Al-Ghamdi RA, Alsaedi ZA, Cruz AJD, Aboasamh GA, Sadagah NM. Immunologic clustering of donor-specific antibodies and clinical outcomes in kidney transplant recipients. World J Transplant 2026; 16(2): 118450
- URL: https://www.wjgnet.com/2220-3230/full/v16/i2/118450.htm
- DOI: https://dx.doi.org/10.5500/wjt.v16.i2.118450