
















Copyright: ©Author(s) 2026.
World J Transplant. Jun 18, 2026; 16(2): 118450
Published online Jun 18, 2026. doi: 10.5500/wjt.v16.i2.118450
Published online Jun 18, 2026. doi: 10.5500/wjt.v16.i2.118450
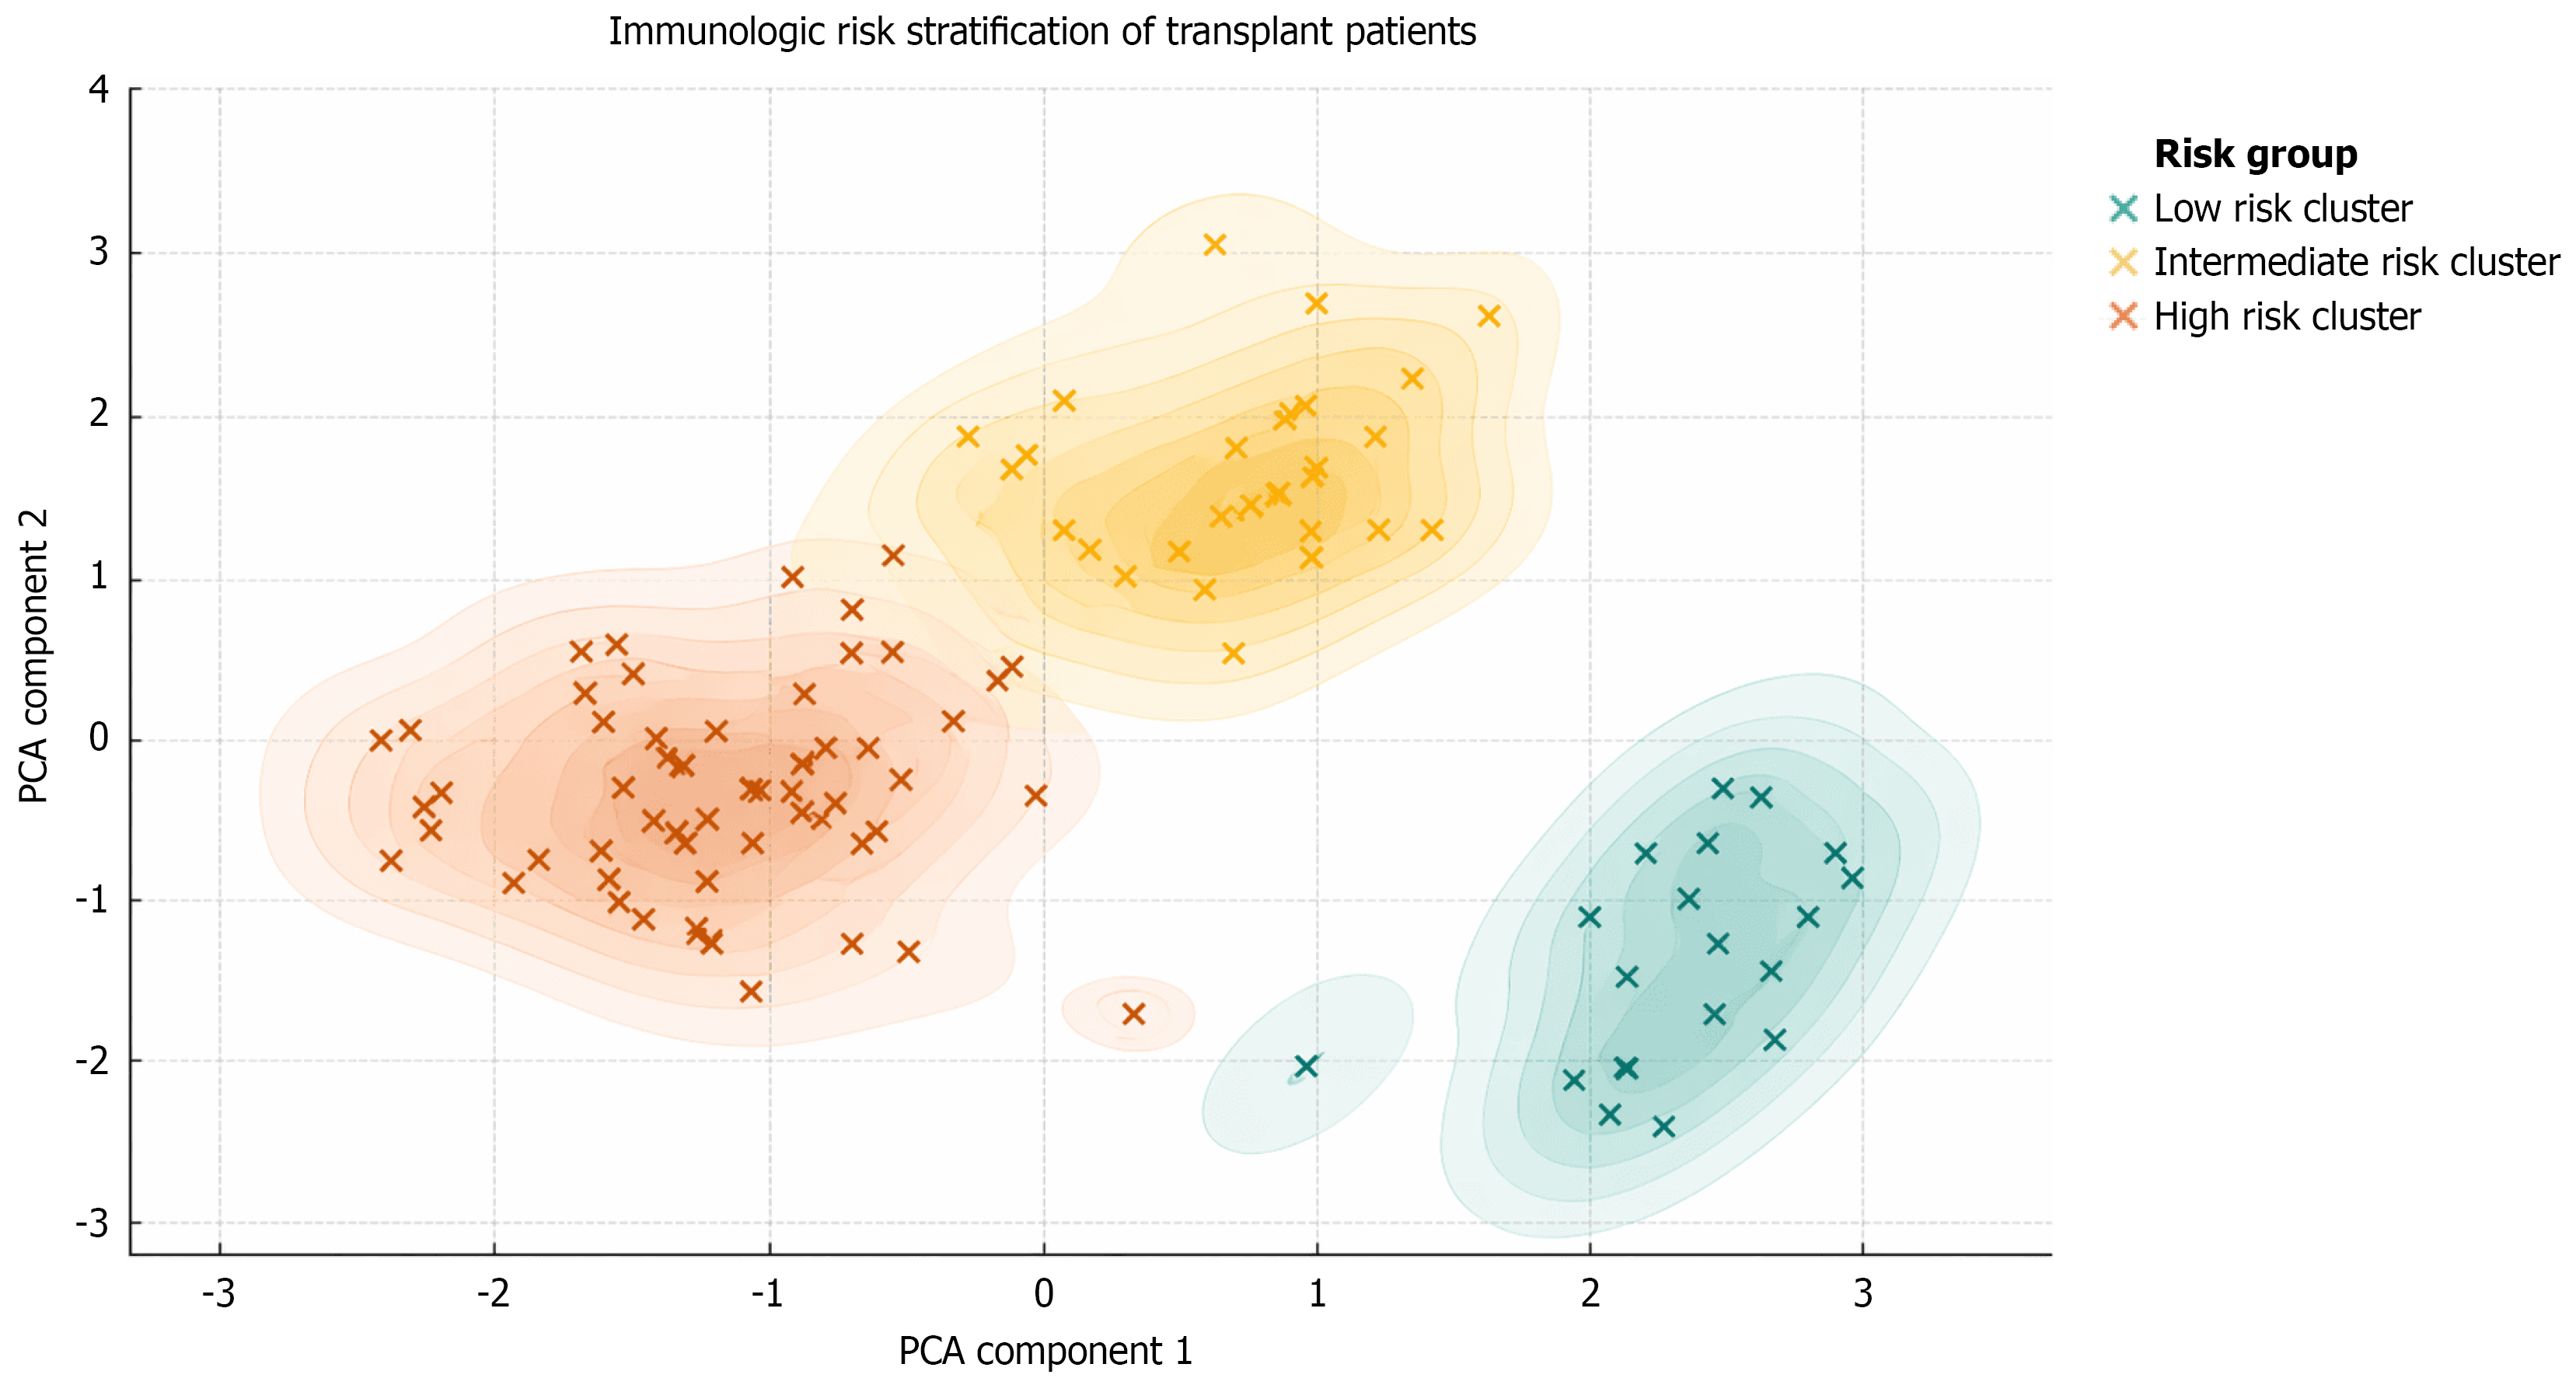
Figure 2 illustrates a principal component analysis.
Each point in this principal component analysis plot represents a donor-specific antibody (DSA)-positive kidney transplant recipient, color-coded by cluster membership, with shaded contours indicating the spatial density of patients within each group. The high-risk cluster (orange) demonstrates tight cohesion and distinct localization, characterized by patients with high mean fluorescence intensity (MFI), multiple DSAs, and mixed Class I and II sensitization. The intermediate-risk cluster (yellow) shows moderate density and spatial separation, predominantly representing Class II DSA patients with moderate immunologic burden. The low-risk cluster (green) occupies a well-isolated region with minimal overlap, encompassing patients with Class I-only DSA, low MFI, and favorable early graft function. While some overlap is observed between the high-risk and intermediate-risk clusters, the core density of each group remains distinct, indicating meaningful stratification. PCA: Principal component analysis.
- Citation: Al-Qurashi SH, Khalil MAM, Mahmood HHK, Alsharif MM, Alqurashi YF, Alghamdi L, Al-Ghamdi RA, Alsaedi ZA, Cruz AJD, Aboasamh GA, Sadagah NM. Immunologic clustering of donor-specific antibodies and clinical outcomes in kidney transplant recipients. World J Transplant 2026; 16(2): 118450
- URL: https://www.wjgnet.com/2220-3230/full/v16/i2/118450.htm
- DOI: https://dx.doi.org/10.5500/wjt.v16.i2.118450