
















©The Author(s) 2026.
World J Transplant. Mar 18, 2026; 16(1): 103656
Published online Mar 18, 2026. doi: 10.5500/wjt.v16.i1.103656
Published online Mar 18, 2026. doi: 10.5500/wjt.v16.i1.103656
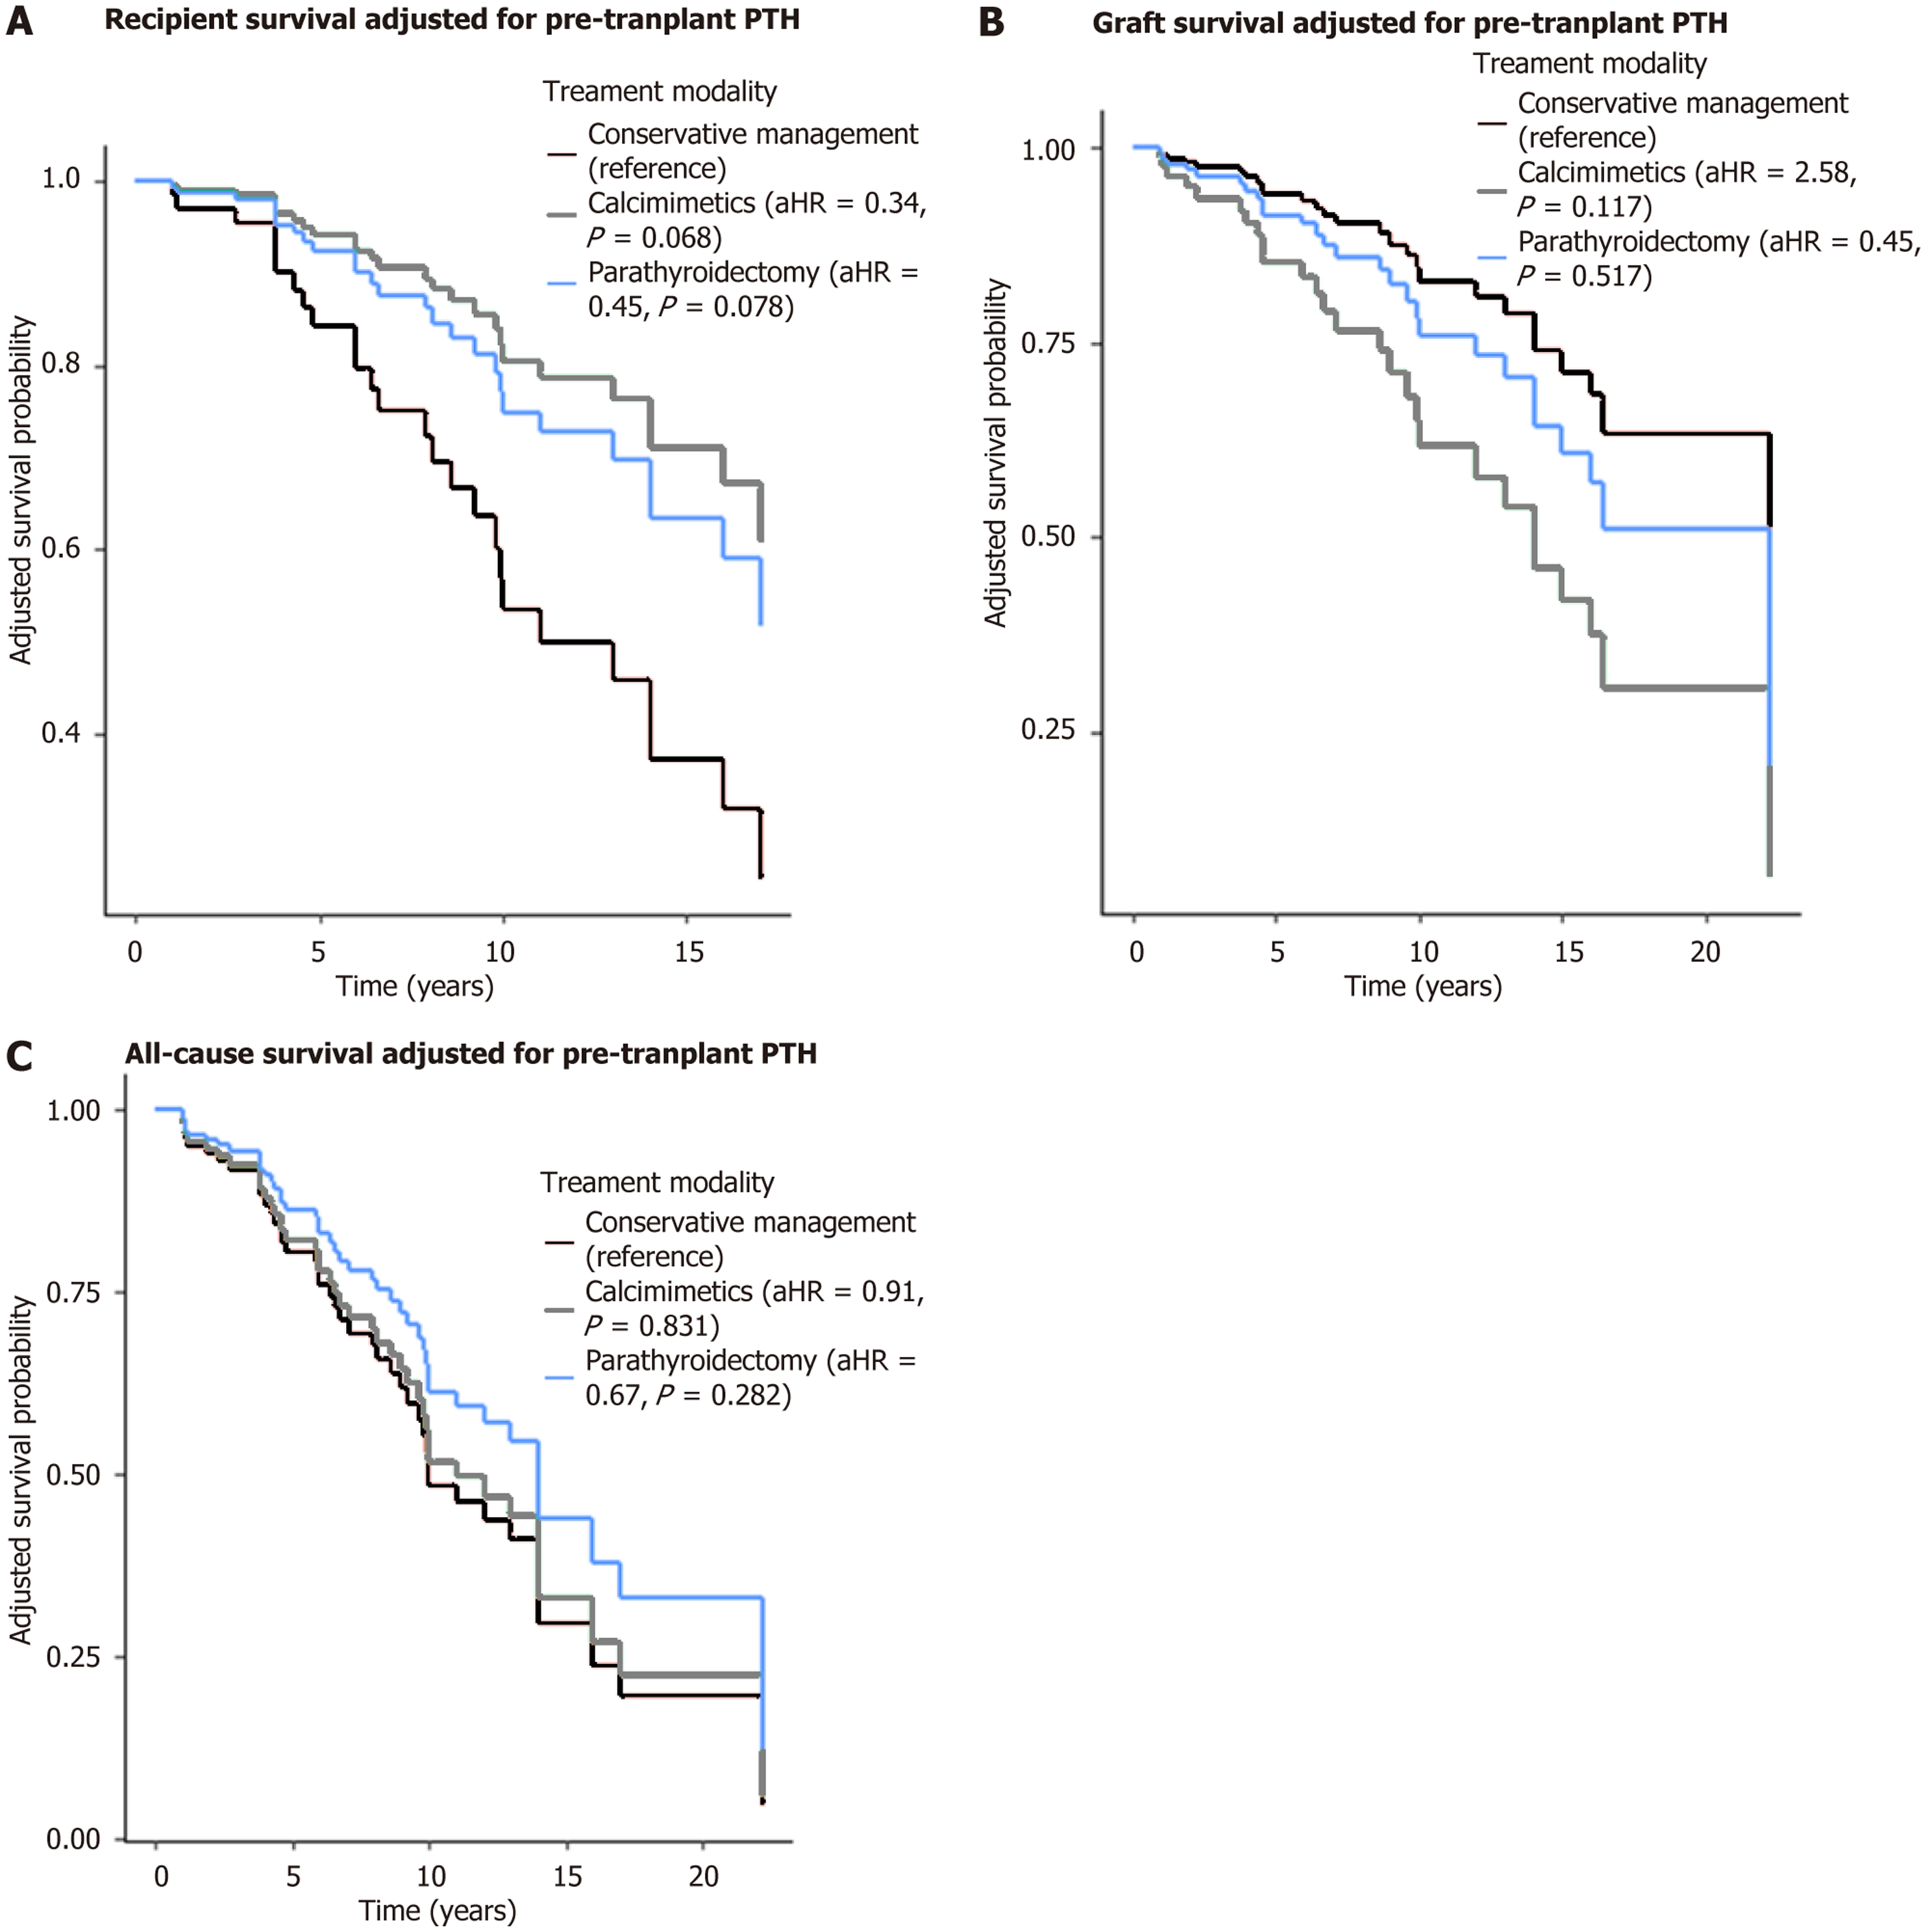
Figure 4 Survival probability (adjusted for pre-transplant parathyroid hormone).
A: Recipient survival by treatment modality; B: Graft survival by treatment modality; C: All-cause survival by treatment modality. Adjusted hazard ratio and P values are shown in the legend for each treatment group, using conservative management as the reference category. There was no statistically significant difference in recipient survival in those who received active treatment compared to those managed conservatively. Cox regression survival curves were adjusted for baseline pre-transplant parathyroid hormone levels using multivariable Cox proportional hazards models. aHR: Adjusted hazard ratio; PTH: Parathyroid hormone.
- Citation: Hanson S, Menendez Lorenzo J, Chukwu CA, Rao A, Middleton R, Kalra PA. Incidence, risk factors and survival outcomes of post-transplant tertiary hyperparathyroidism in kidney recipients. World J Transplant 2026; 16(1): 103656
- URL: https://www.wjgnet.com/2220-3230/full/v16/i1/103656.htm
- DOI: https://dx.doi.org/10.5500/wjt.v16.i1.103656