
















©The Author(s) 2026.
World J Transplant. Mar 18, 2026; 16(1): 103656
Published online Mar 18, 2026. doi: 10.5500/wjt.v16.i1.103656
Published online Mar 18, 2026. doi: 10.5500/wjt.v16.i1.103656
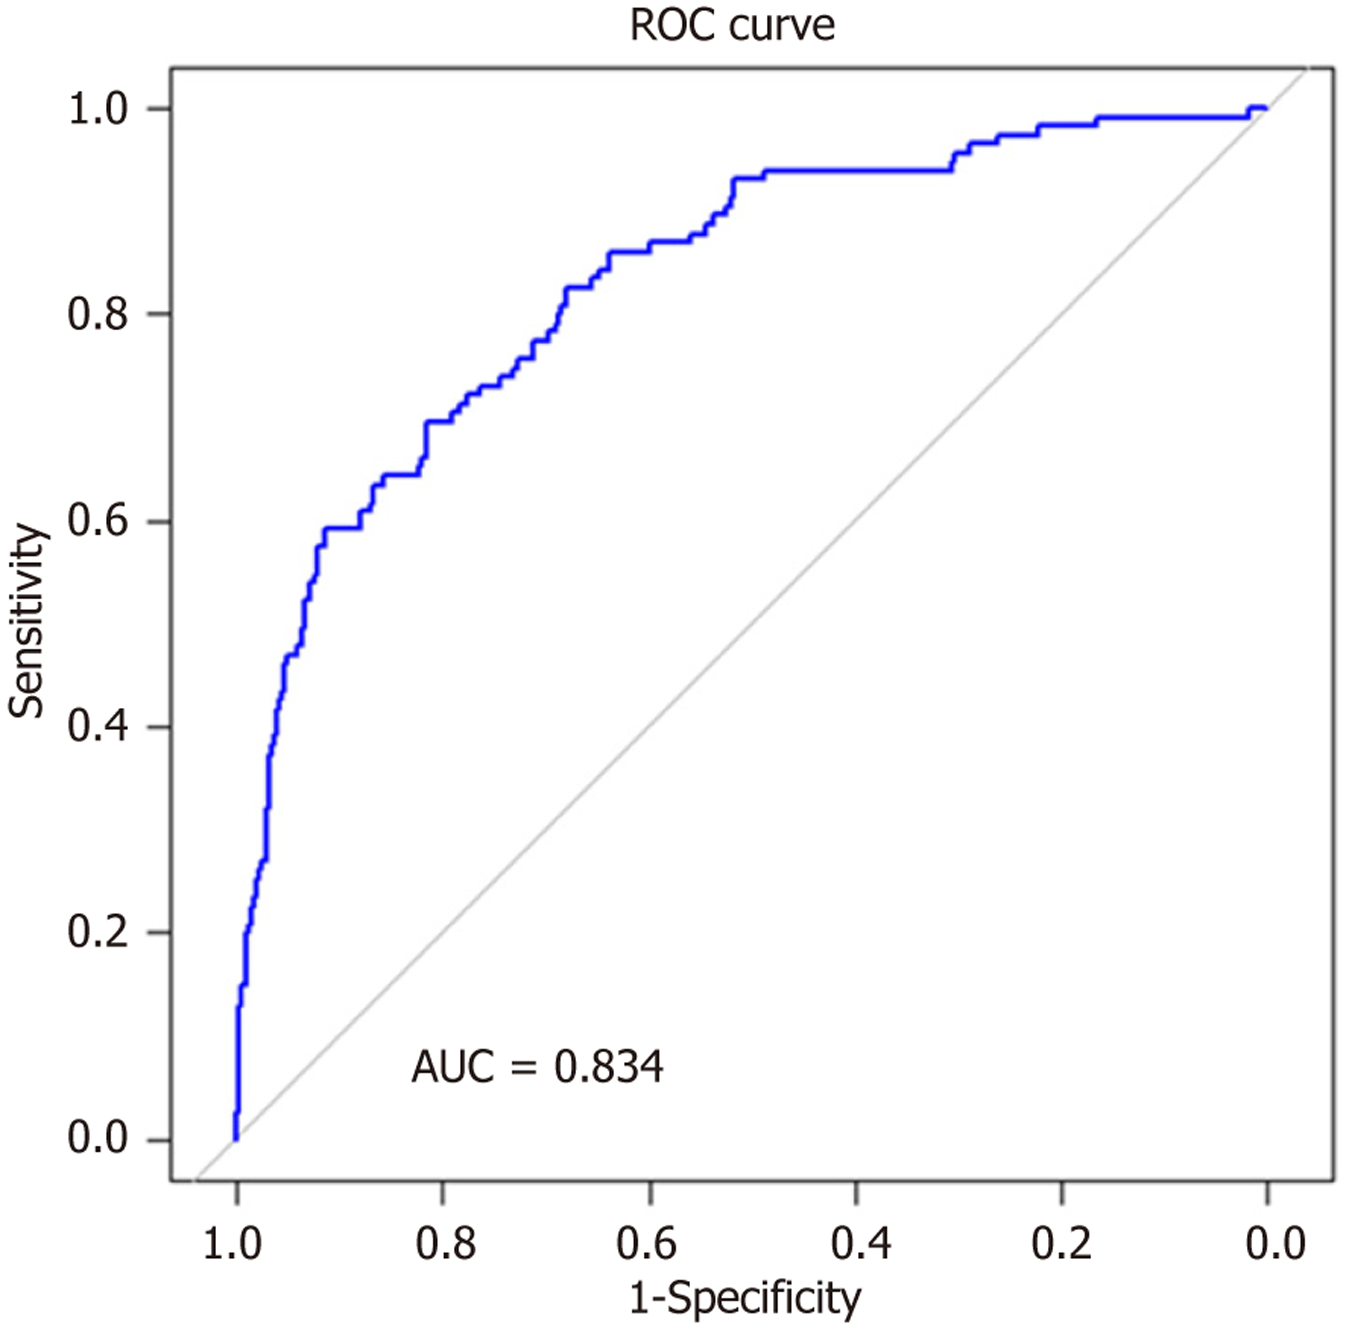
Figure 2 Receiver operating characteristic curve for the logistic regression model predicting post-transplant tertiary hyperparathyr
- Citation: Hanson S, Menendez Lorenzo J, Chukwu CA, Rao A, Middleton R, Kalra PA. Incidence, risk factors and survival outcomes of post-transplant tertiary hyperparathyroidism in kidney recipients. World J Transplant 2026; 16(1): 103656
- URL: https://www.wjgnet.com/2220-3230/full/v16/i1/103656.htm
- DOI: https://dx.doi.org/10.5500/wjt.v16.i1.103656