
















©The Author(s) 2025.
World J Transplant. Dec 18, 2025; 15(4): 111427
Published online Dec 18, 2025. doi: 10.5500/wjt.v15.i4.111427
Published online Dec 18, 2025. doi: 10.5500/wjt.v15.i4.111427
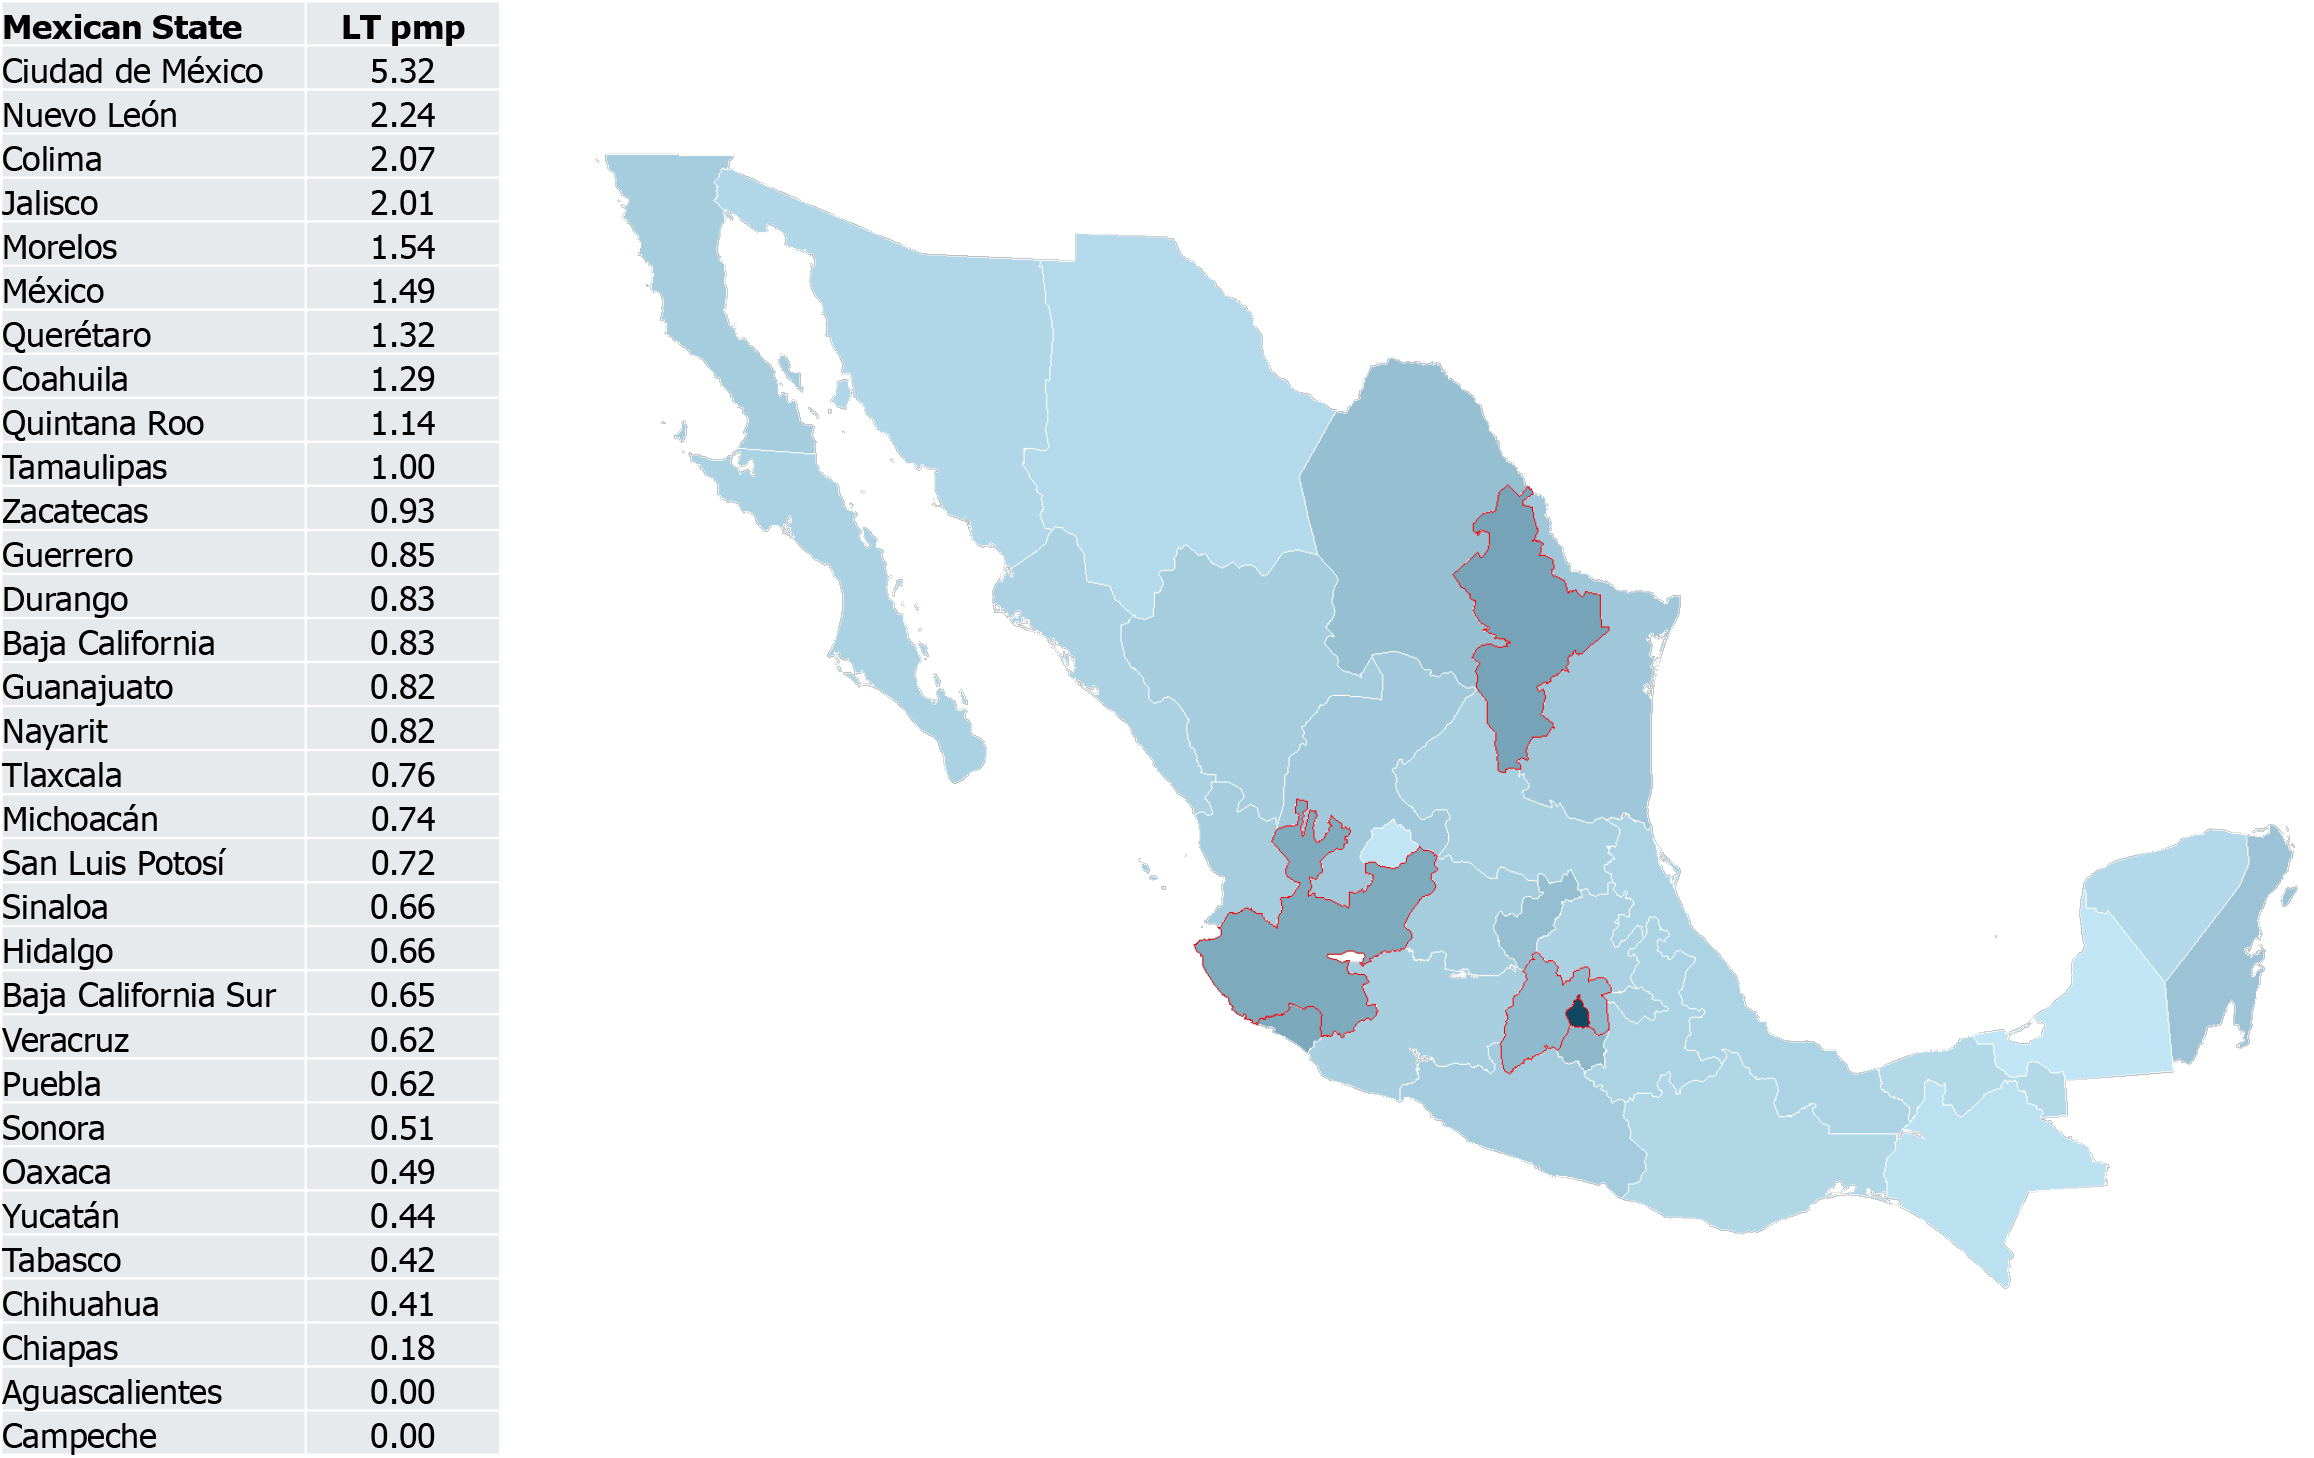
Figure 3 Heatmap of liver transplantations observed between 2014 and 2023 according to the Mexican State of residence controlled by population (per million persons).
States with high liver transplantation activity are marked in red. pmp: Per million persons; LT: Liver transplantation.
- Citation: Leal-Leyte P, Rodriguez-Payan N, Cote MP, Noriega-Salas L, Lugo-Baruqui A, Dageforde LA, Zamora-Valdés D. Geographical disparities for liver transplantation access in Mexico. World J Transplant 2025; 15(4): 111427
- URL: https://www.wjgnet.com/2220-3230/full/v15/i4/111427.htm
- DOI: https://dx.doi.org/10.5500/wjt.v15.i4.111427