
















©The Author(s) 2025.
World J Transplant. Dec 18, 2025; 15(4): 107728
Published online Dec 18, 2025. doi: 10.5500/wjt.v15.i4.107728
Published online Dec 18, 2025. doi: 10.5500/wjt.v15.i4.107728
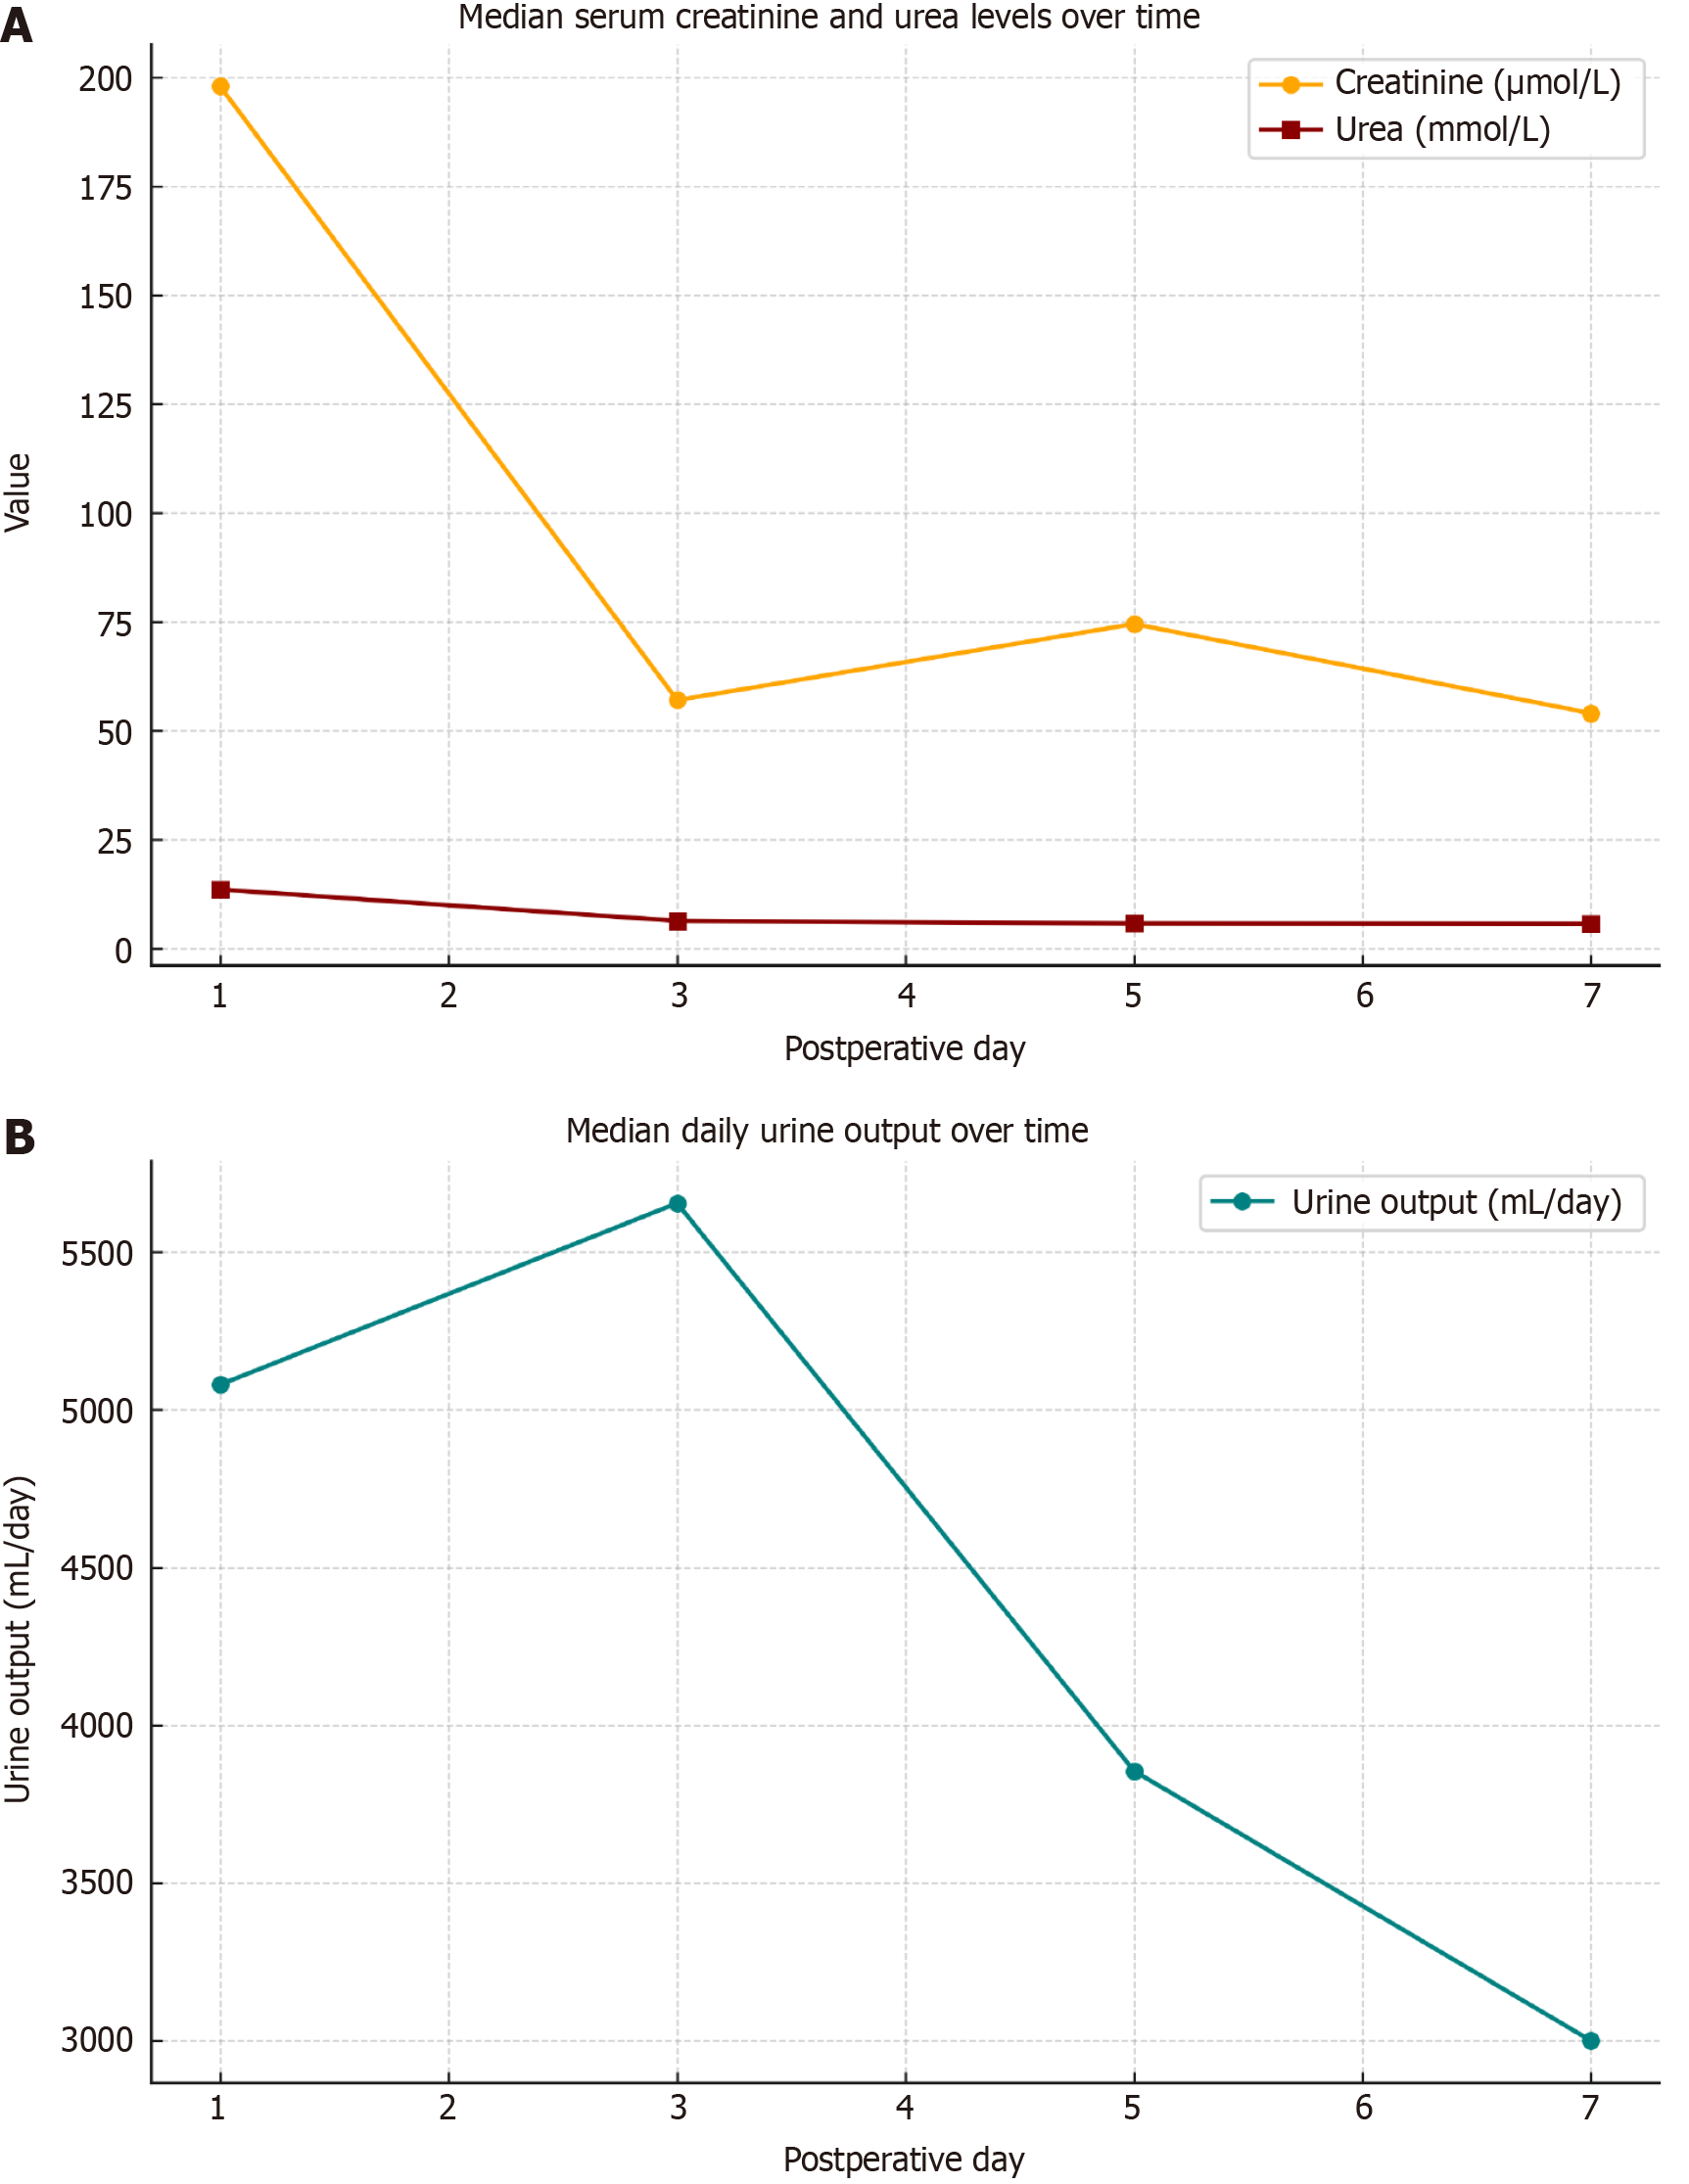
Figure 2 Trends in kidney function markers and urine output before and during the first postoperative week.
A: Median serum creatinine and urea levels on postoperative days 1, 3, 5, and 7. Both markers demonstrated a progressive decline, reflecting early recovery of graft function; B: Median daily urine output over the same period. Urine output peaked on day 3, consistent with the expected polyuric phase, and gradually decreased by day 7 while remaining above the normal range.
- Citation: Semash K, Akhmedov A, Dzhanbekov T, Umarov Q, Dustmurodov J. Implementation of a pediatric kidney transplantation program in Uzbekistan: Feasibility and early outcomes. World J Transplant 2025; 15(4): 107728
- URL: https://www.wjgnet.com/2220-3230/full/v15/i4/107728.htm
- DOI: https://dx.doi.org/10.5500/wjt.v15.i4.107728