Copyright
©The Author(s) 2025.
World J Transplant. Sep 18, 2025; 15(3): 102378
Published online Sep 18, 2025. doi: 10.5500/wjt.v15.i3.102378
Published online Sep 18, 2025. doi: 10.5500/wjt.v15.i3.102378
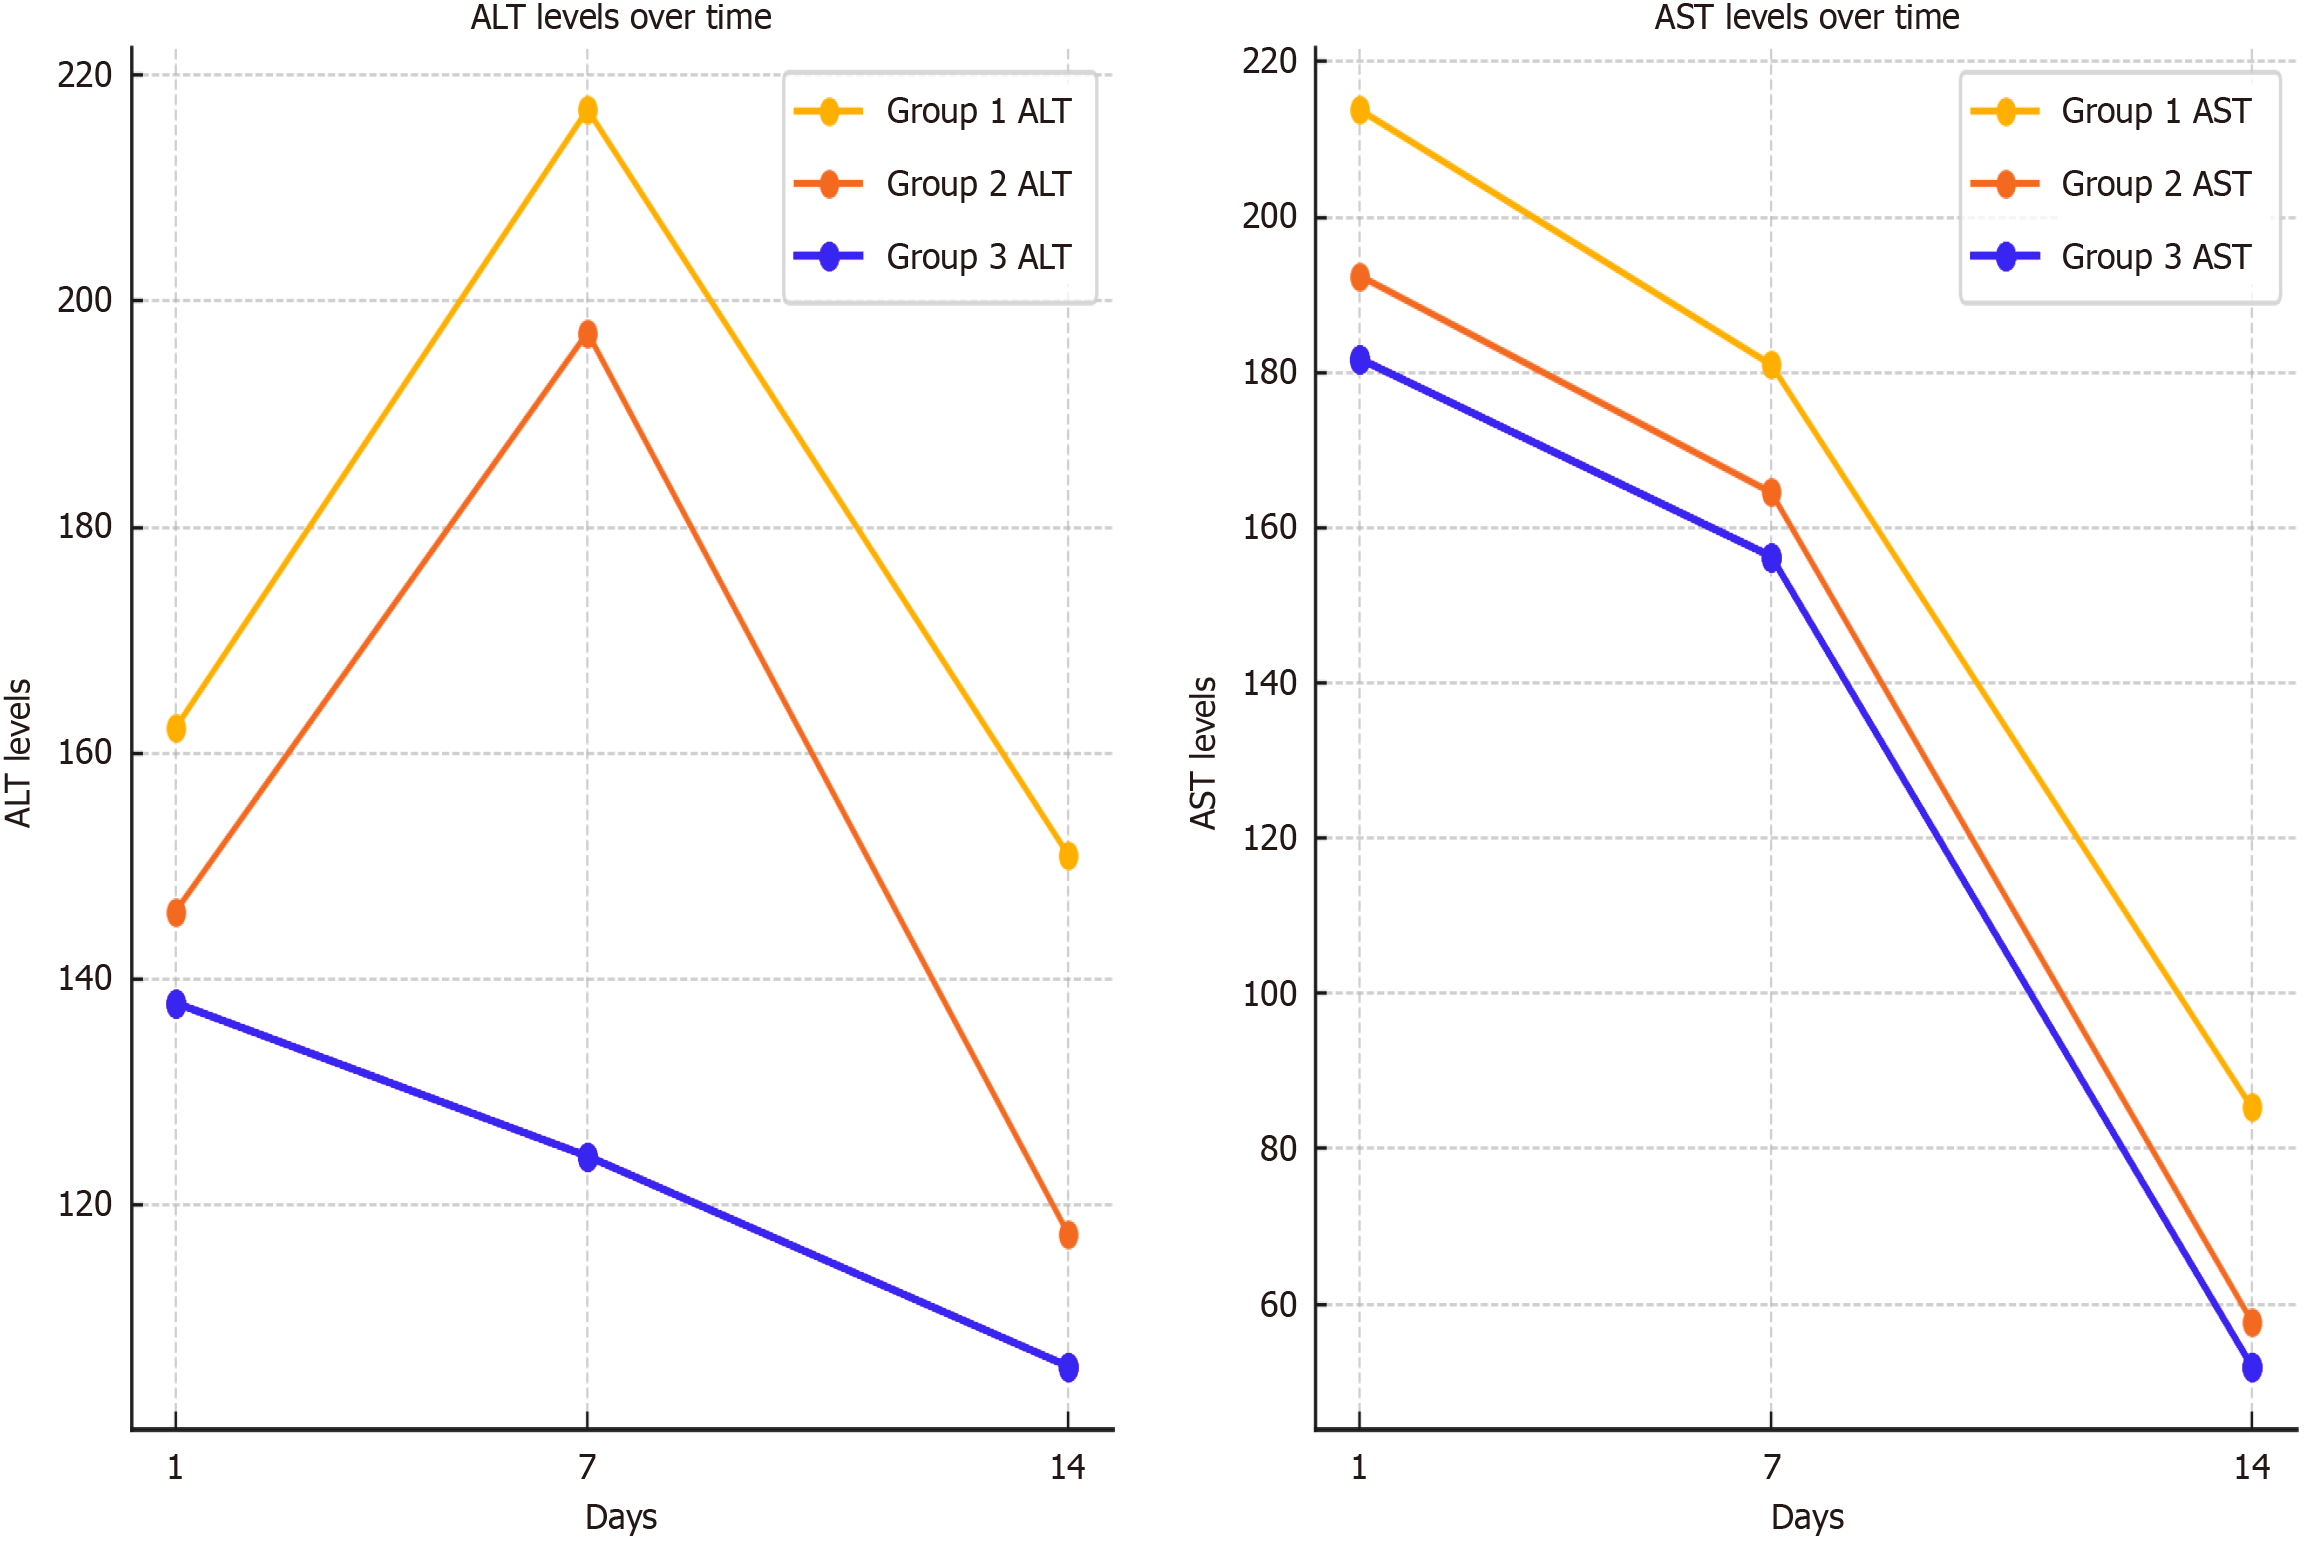
Figure 7 Alanine aminotransferase/aspartate aminotransferase levels over time.
This diagram illustrates the changes in alanine aminotransferase (ALT) and aspartate aminotransferase (AST) levels over time for three different groups on day 1, day 7, and day 14. Group 1 shows an initial rise in both ALT and AST levels followed by a decline. Group 2 shows a similar trend but with a lower peak on day 7. Group 3 displays a consistent decrease in both ALT and AST levels over the 14 days, indicating a different response pattern compared to the other groups. ALT: Alanine aminotransferase; AST: Aspartate aminotransferase.
- Citation: Beridze D, Mikeladze L, Tomadze G, Kordzaia D, Kashibadze K. Peculiarities of implantation of the right graft veins into the inferior vena cava during living donor liver transplantation. World J Transplant 2025; 15(3): 102378
- URL: https://www.wjgnet.com/2220-3230/full/v15/i3/102378.htm
- DOI: https://dx.doi.org/10.5500/wjt.v15.i3.102378


