Copyright
©The Author(s) 2025.
World J Transplant. Sep 18, 2025; 15(3): 102378
Published online Sep 18, 2025. doi: 10.5500/wjt.v15.i3.102378
Published online Sep 18, 2025. doi: 10.5500/wjt.v15.i3.102378
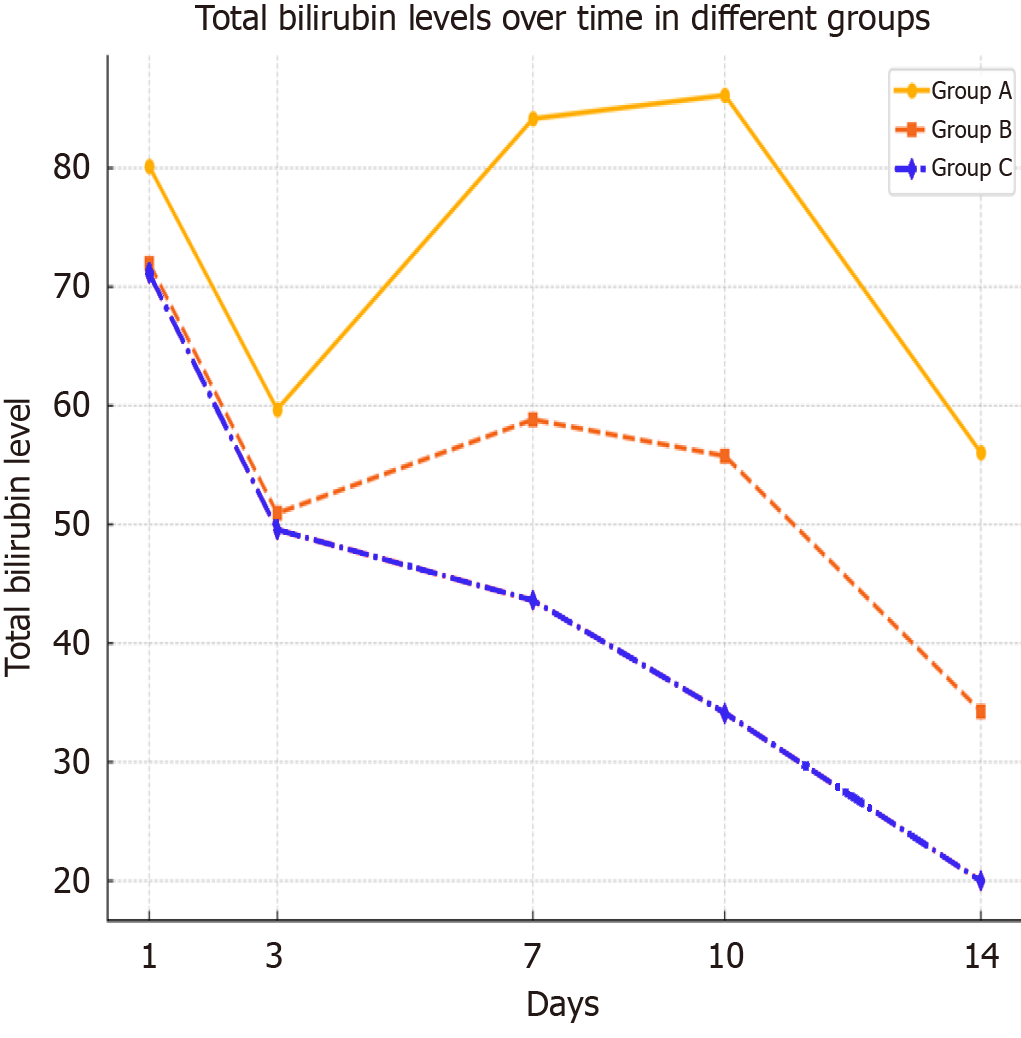
Figure 6 The graph shows the total bilirubin levels across different days for group 1, group 2, and group 3.
Group 1 starts at a higher level compared to the other groups, experiencing fluctuations over the period, while group 2 and group 3 show a more consistent decrease.
- Citation: Beridze D, Mikeladze L, Tomadze G, Kordzaia D, Kashibadze K. Peculiarities of implantation of the right graft veins into the inferior vena cava during living donor liver transplantation. World J Transplant 2025; 15(3): 102378
- URL: https://www.wjgnet.com/2220-3230/full/v15/i3/102378.htm
- DOI: https://dx.doi.org/10.5500/wjt.v15.i3.102378


