Copyright
©The Author(s) 2023.
World J Transplant. Dec 18, 2023; 13(6): 379-390
Published online Dec 18, 2023. doi: 10.5500/wjt.v13.i6.379
Published online Dec 18, 2023. doi: 10.5500/wjt.v13.i6.379
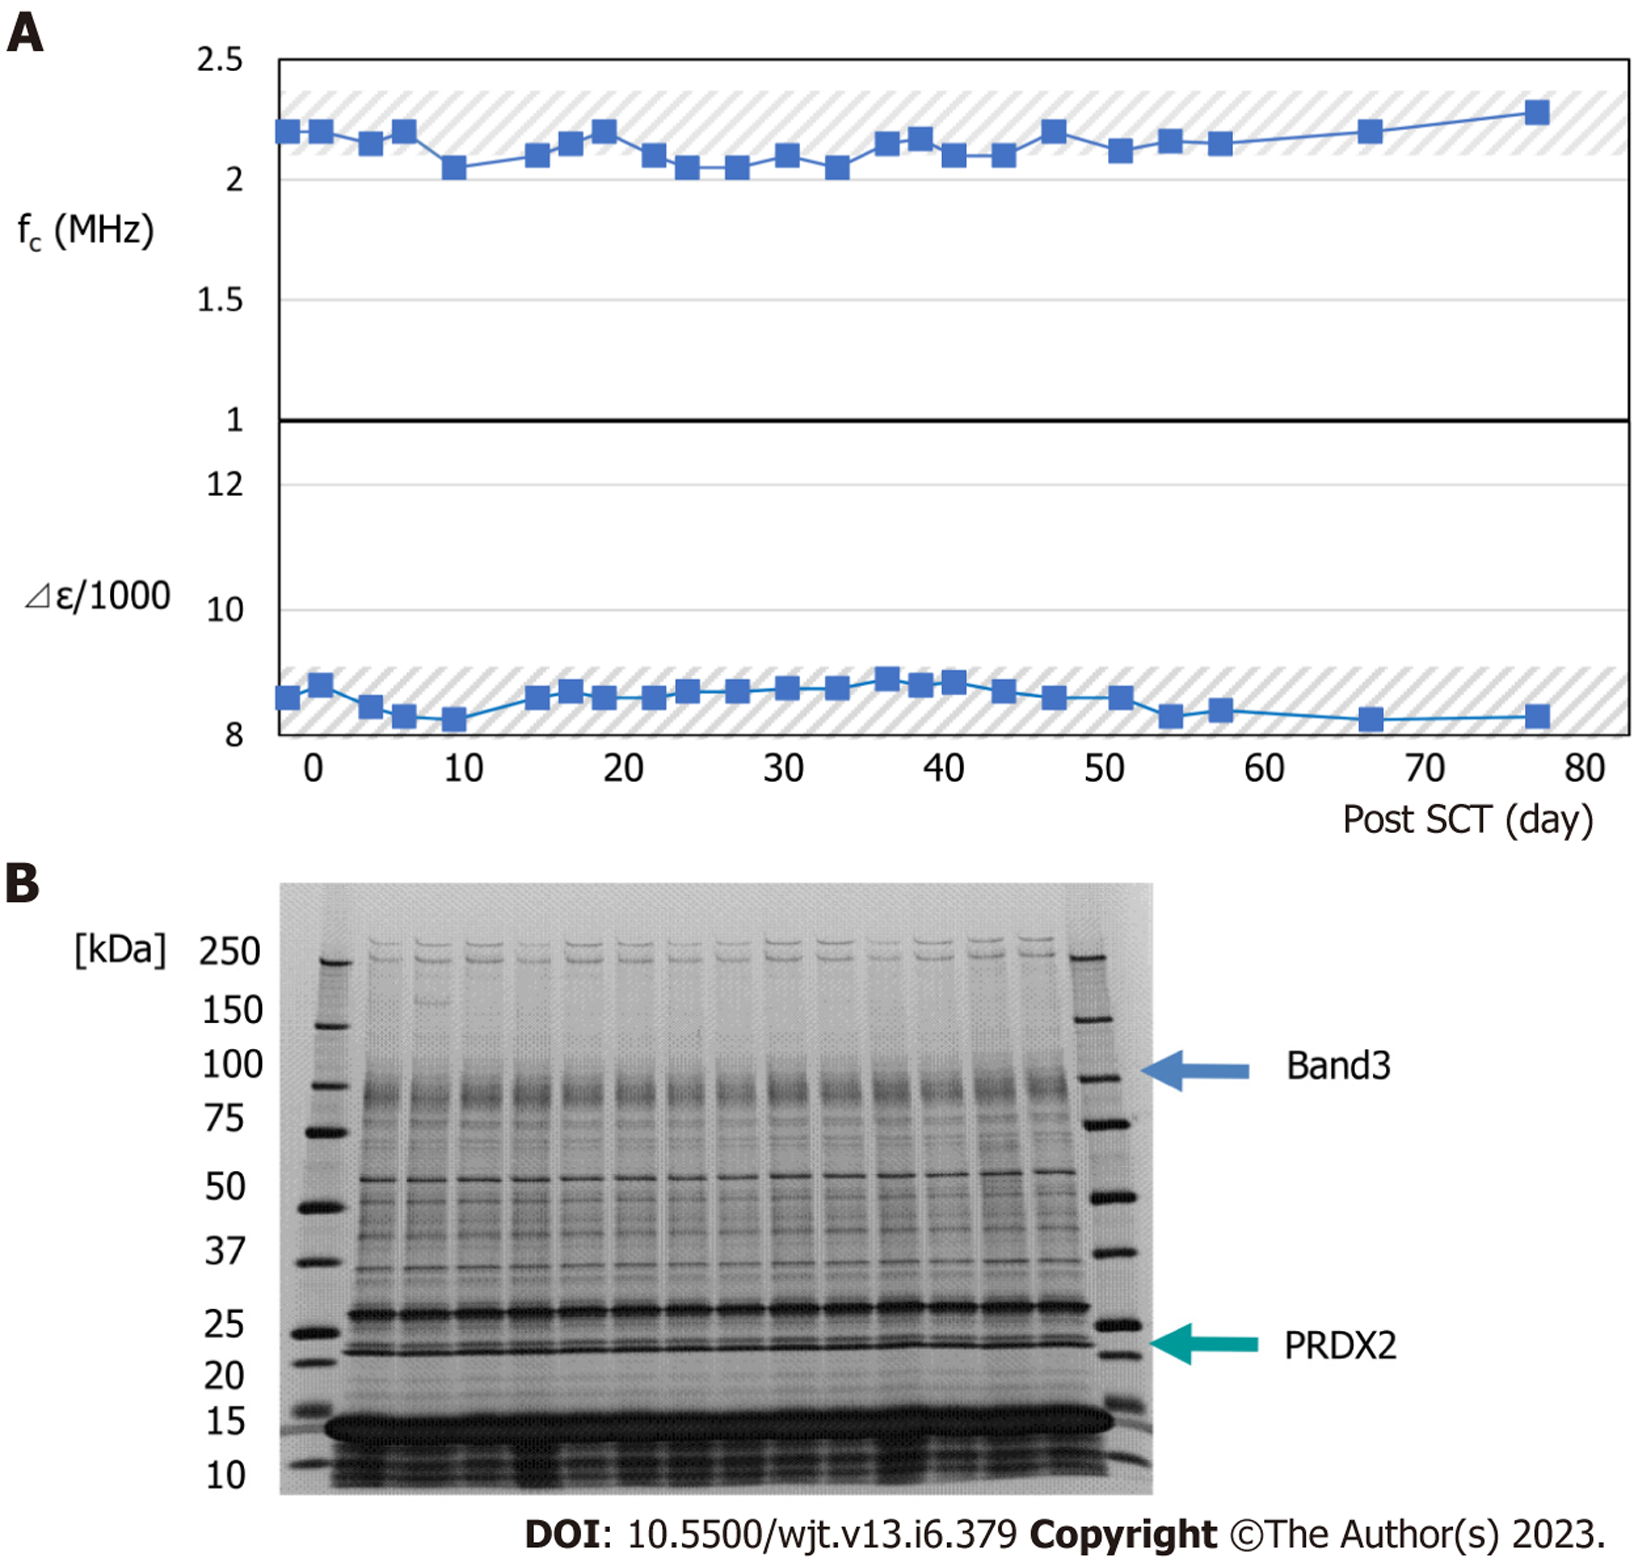
Figure 4 Changes in the relaxation frequency and relaxation intensity of whole blood after transplantation in a transplant patient who developed no graft-versus-host disease during the course.
A: The hatched area indicates the normal range of relaxation frequency and relaxation intensity; B: The figure below shows the results of sodium dodecyl sulfate-polyacrylamide gel electrophoresis of erythrocyte proteins over time. There was no significant change.
- Citation: Nagasawa M. Pathophysiology of acute graft-versus-host disease from the perspective of hemodynamics determined by dielectric analysis. World J Transplant 2023; 13(6): 379-390
- URL: https://www.wjgnet.com/2220-3230/full/v13/i6/379.htm
- DOI: https://dx.doi.org/10.5500/wjt.v13.i6.379


