Copyright
©The Author(s) 2023.
World J Transplant. Dec 18, 2023; 13(6): 379-390
Published online Dec 18, 2023. doi: 10.5500/wjt.v13.i6.379
Published online Dec 18, 2023. doi: 10.5500/wjt.v13.i6.379
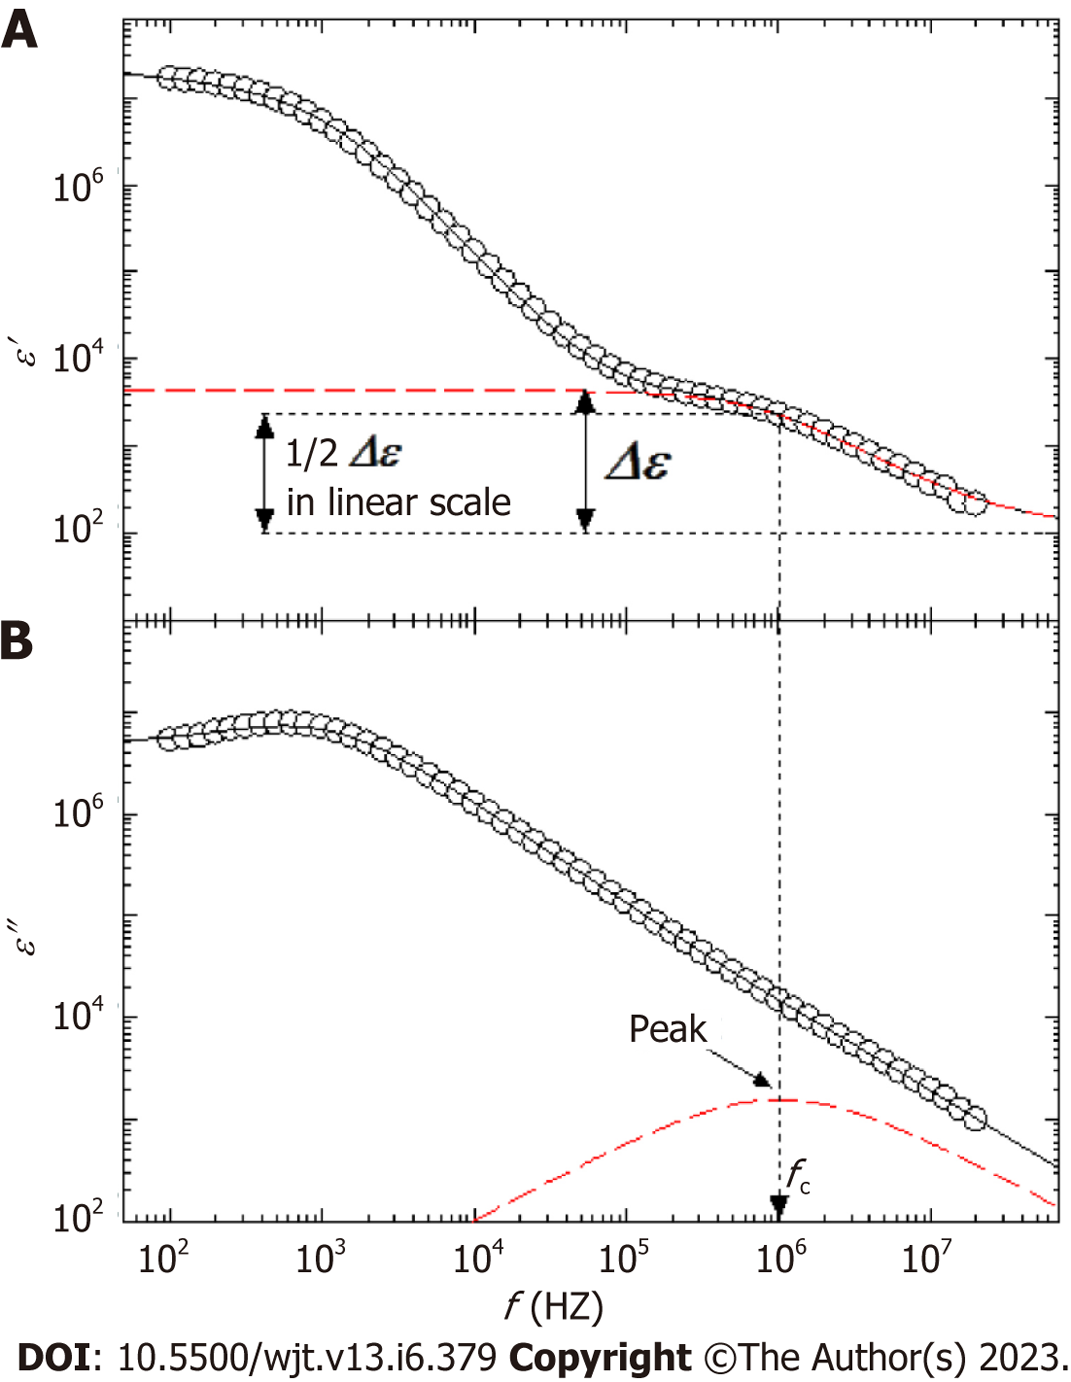
Figure 2 Understanding of the dielectric relaxation of whole blood, which is consist of plasma and blood cells.
A: Shows the real part; B: The imaginary part of the complex permittivity. The broken red lines are the result of an analysis of the interfacial polarization phenomenon according to a Cole−Cole type dielectric relaxation function. This function is characterized by the relaxation strength Δε corresponding to changes in ε′ (A) and the relaxation frequency fc that corresponds to the peak of this function observed in the imaginary part of permittivity, ε″ (B). The curved lines in the figure are the sum of all the assumed contributions in the analysis, and agree well with the experimental values.
- Citation: Nagasawa M. Pathophysiology of acute graft-versus-host disease from the perspective of hemodynamics determined by dielectric analysis. World J Transplant 2023; 13(6): 379-390
- URL: https://www.wjgnet.com/2220-3230/full/v13/i6/379.htm
- DOI: https://dx.doi.org/10.5500/wjt.v13.i6.379


