Copyright
©The Author(s) 2021.
World J Transplant. Mar 18, 2021; 11(3): 70-86
Published online Mar 18, 2021. doi: 10.5500/wjt.v11.i3.70
Published online Mar 18, 2021. doi: 10.5500/wjt.v11.i3.70
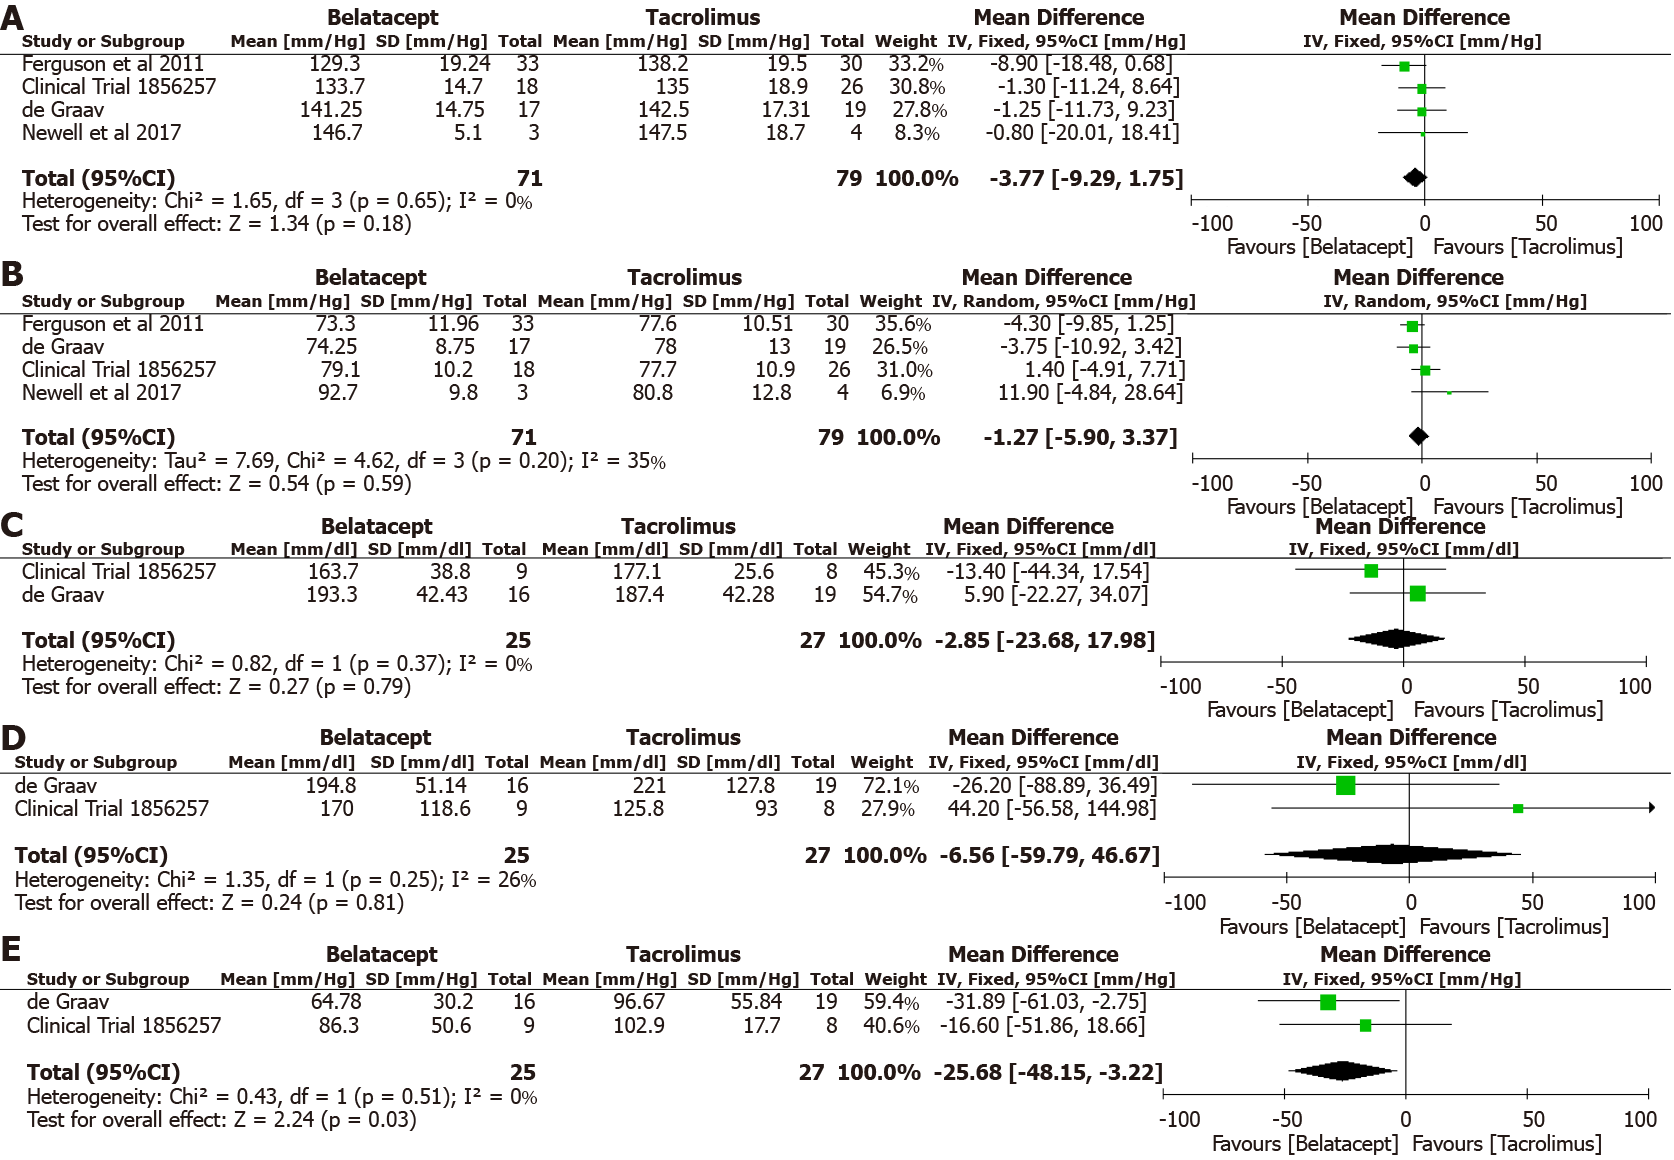
Figure 5 Forest plot represents the changes at 12 mo in kidney transplant recipients when treated with belatacept or tacrolimus.
Squares represent size effects of studies, comparing the weight of the study in the meta-analysis. 95 percent confidence intervals represented in horizontal bars. A: The systolic blood pressure at 12 mo in kidney transplant recipients. The diamond doesn't suggest any significant difference following fixed effects analysis; B: The diastolic blood pressure at 12 mo in kidney transplant recipients. The diamond doesn't suggest any significant difference following random effects analysis; C: Serum total cholesterol at 12 mo in kidney transplant recipients. The diamond doesn't suggest any significant difference following fixed effects analysis; D: Serum triglycerides at 12 mo in kidney transplant recipients. The diamond doesn't suggest any significant difference following fixed effects analysis; E: Serum low density lipoprotein at 12 mo in kidney transplant recipients. The diamond suggests favour towards belatacept group following fixed effects analysis.
- Citation: Kumar J, Reccia I, Virdis F, Podda M, Sharma AK, Halawa A. Belatacept in renal transplantation in comparison to tacrolimus and molecular understanding of resistance pattern: Meta-analysis and systematic review. World J Transplant 2021; 11(3): 70-86
- URL: https://www.wjgnet.com/2220-3230/full/v11/i3/70.htm
- DOI: https://dx.doi.org/10.5500/wjt.v11.i3.70


