Copyright
©The Author(s) 2017.
World J Transplant. Jun 24, 2017; 7(3): 203-212
Published online Jun 24, 2017. doi: 10.5500/wjt.v7.i3.203
Published online Jun 24, 2017. doi: 10.5500/wjt.v7.i3.203
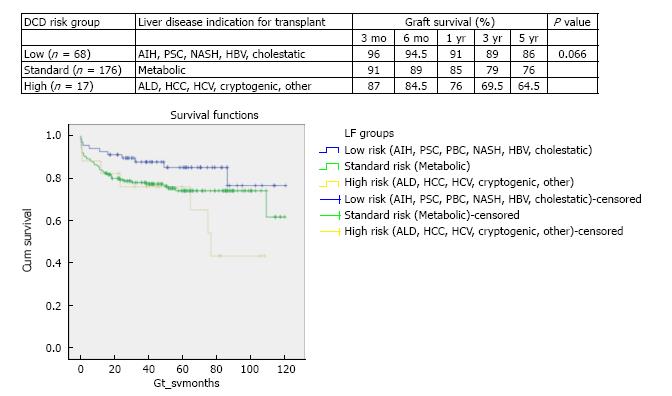
Figure 1 Stratified Kaplan-Meier curves for the cumulative donor after cardiac death graft survival in relation to primary indication for transplant and respective 3 mo, 6 mo, 1 year, 3 years and 5 years survival (χ2 5.
1 log-rank, P = 0.066). This stratification of indication for transplant defining the three risk groups of low, standard and high. Low DCD risk indications for transplant included autoimmune hepatitis (AIH), primary sclerosing cholangitis (PSC), primary biliary cirrhosis (PBC), non-alcoholic steatohepatitis (NASH), hepatitis B virus (HBV) and cholestatic liver disease (primary familial intrahepatic cholestasis, extrahepatic biliary atresia and Crigler Najjar). Standard risk indications were metabolic diseases that included Wilson’s, Hemochromatosis and Familial Amyloid Polyneuropathy. High risk indications for DCD transplant were alcohol related liver disease (ALD), hepatocellular carcinoma (HCC), hepatitis C virus (HCV), cryptogenic and Budd Chiari.
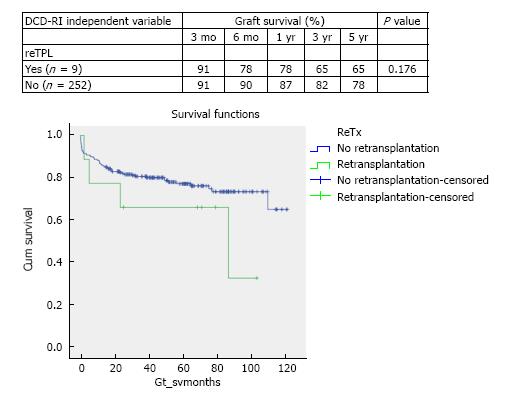
Figure 2 Stratified Kaplan-Meier curves for the cumulative DCD graft survival in relation to use in retransplantation or not and respective 3 mo, 6 mo, 1 year, 3 years and 5 years survival rates (χ2 1.
8 log-rank, P = 0.176).
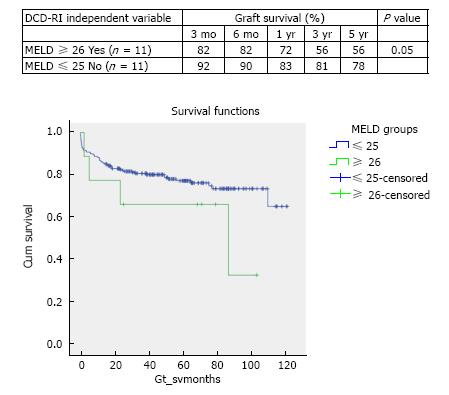
Figure 3 Stratified Kaplan-Meier curves for the cumulative DCD graft survival in relation to MELD and respective 3 mo, 6 mo, 1 year, 3 year and 5 year survival rates (χ2 3.
8 Log-Rank, P = 0.05).
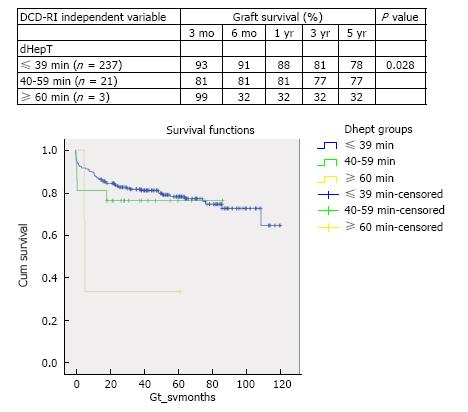
Figure 4 Stratified Kaplan-Meier curves for the cumulative DCD graft survival in relation to DCD donor hepatectomy time (dHepT) and respective 3 mo, 6 mo, 1 year, 3 years and 5 years survival rates (χ2 4.
8 Log-Rank, P = 0.028).
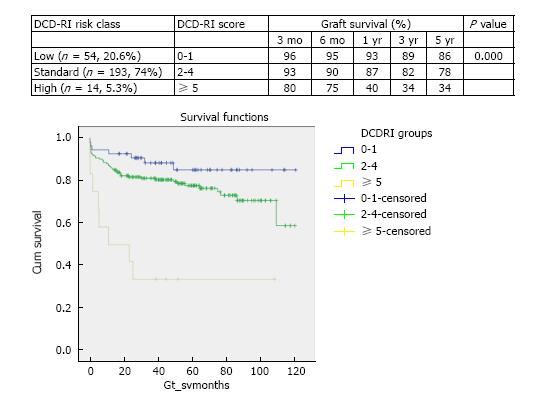
Figure 5 Stratified Kaplan-Meier curves for the cumulative DCD graft survival in relation to their DCD-RI score and respective 3 mo, 6 mo, 1 year, 3 years and 5 years survival (log-rank P = 0.
000). The DCD-RI score divides the study cohort into three DCD-RI risk classes of Low (DCD-RI = 0-1), Standard (DCD-RI = 2-4) and High (DCD-RI ≥ 5).
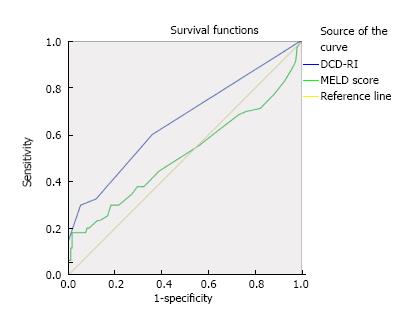
Figure 6 DCD-RI receiver operator curve and comparison to other predictive models illustrating that the DCD-RI performed better than model for end-stage liver disease in predicting graft survival.
DCD-RI c-statistic = 0.657 and MELD c-statistic = 0.514). MELD: Model for end-stage liver disease; DCD-RI: Donor after cardiac death risk index.
- Citation: Khorsandi SE, Giorgakis E, Vilca-Melendez H, O’Grady J, Heneghan M, Aluvihare V, Suddle A, Agarwal K, Menon K, Prachalias A, Srinivasan P, Rela M, Jassem W, Heaton N. Developing a donation after cardiac death risk index for adult and pediatric liver transplantation. World J Transplant 2017; 7(3): 203-212
- URL: https://www.wjgnet.com/2220-3230/full/v7/i3/203.htm
- DOI: https://dx.doi.org/10.5500/wjt.v7.i3.203


