Copyright
©2014 Baishideng Publishing Group Inc.
World J Rheumatol. Nov 12, 2014; 4(3): 72-79
Published online Nov 12, 2014. doi: 10.5499/wjr.v4.i3.72
Published online Nov 12, 2014. doi: 10.5499/wjr.v4.i3.72
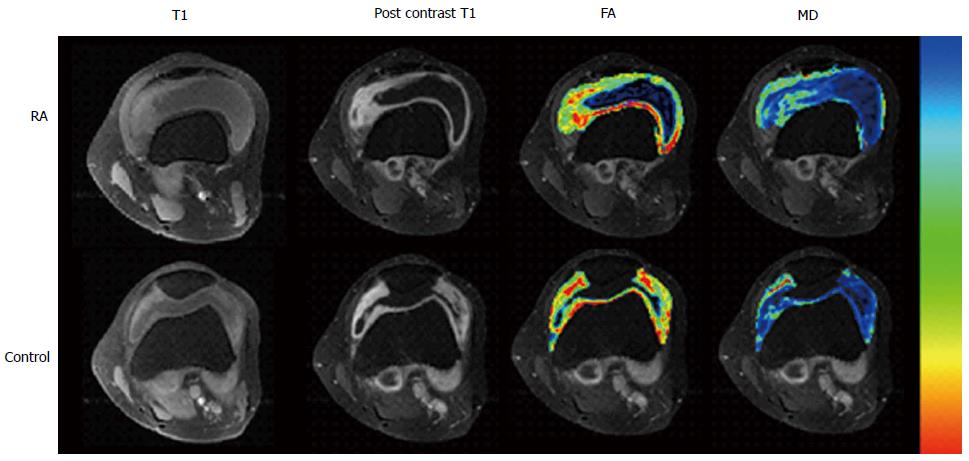
Figure 1 A 45-year-old male rheumatoid arthritis synovium shows strong enhancement on fat suppressed post-contrast T1-weighted axial image.
Color coded fractional anisotropy (FA = 0.26) map from segmented region of enhanced synovial membrane overlaid on post-contrast fat-suppressed T1-weighted image show increased FA as compared to control (FA = 0.19). Mean diffusivity being inversely related to FA showed low values (1.01 × 10⁻³ mm2/s). Color red denotes increased whereas blue denotes decreased values. RA: Rheumatoid arthritis; MD: Mean diffusivity; FA: Fractional anisotropy.
- Citation: Tripathi D, Agarwal V. Quantifying synovial inflammation: Emerging imaging techniques. World J Rheumatol 2014; 4(3): 72-79
- URL: https://www.wjgnet.com/2220-3214/full/v4/i3/72.htm
- DOI: https://dx.doi.org/10.5499/wjr.v4.i3.72


