















Copyright: ©Author(s) 2026.
World J Psychiatry. Sep 19, 2026; 16(9): 120517
Published online Sep 19, 2026. doi: 10.5498/wjp.120517
Published online Sep 19, 2026. doi: 10.5498/wjp.120517
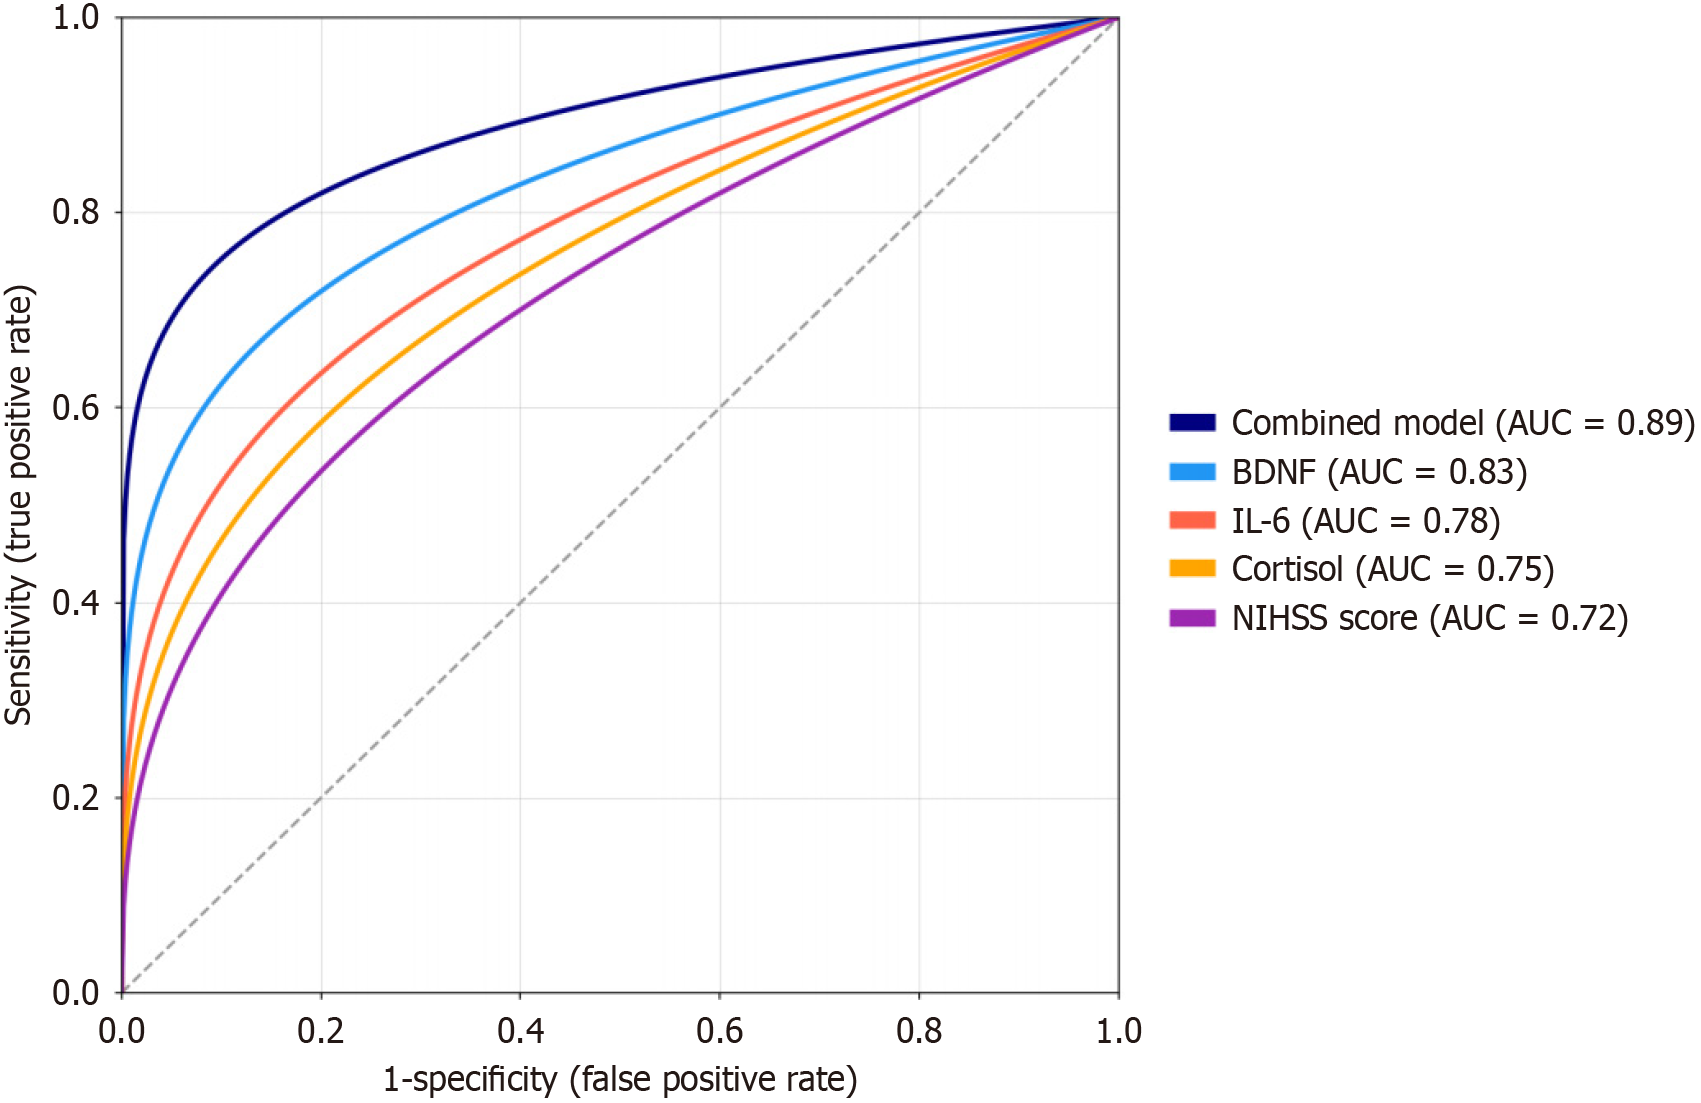
Figure 1 Receiver operating characteristic curves comparing the diagnostic performance of the combined predictive model and individual biomarkers for post-stroke depression.
The combined model integrating clinical, neuroimaging, and biochemical parameters achieved the highest area under the curve = 0.89, followed by brain-derived neurotrophic factor alone (area under the curve = 0.83). All curves were significantly superior to the reference line (all P < 0.001). AUC: Area under the curve; BDNF: Brain-derived neurotrophic factor; IL: Interleukin; NIHSS: National Institutes of Health Stroke Scale.
- Citation: Yang JY, Hu BH, Liu FZ, Gao YX. Predictive factors for post-cerebral infarction depression: A retrospective study of 156 patients. World J Psychiatry 2026; 16(9): 120517
- URL: https://www.wjgnet.com/2220-3206/full/v16/i9/120517.htm
- DOI: https://dx.doi.org/10.5498/wjp.120517