
















Copyright: ©Author(s) 2026.
World J Psychiatry. Sep 19, 2026; 16(9): 119308
Published online Sep 19, 2026. doi: 10.5498/wjp.119308
Published online Sep 19, 2026. doi: 10.5498/wjp.119308
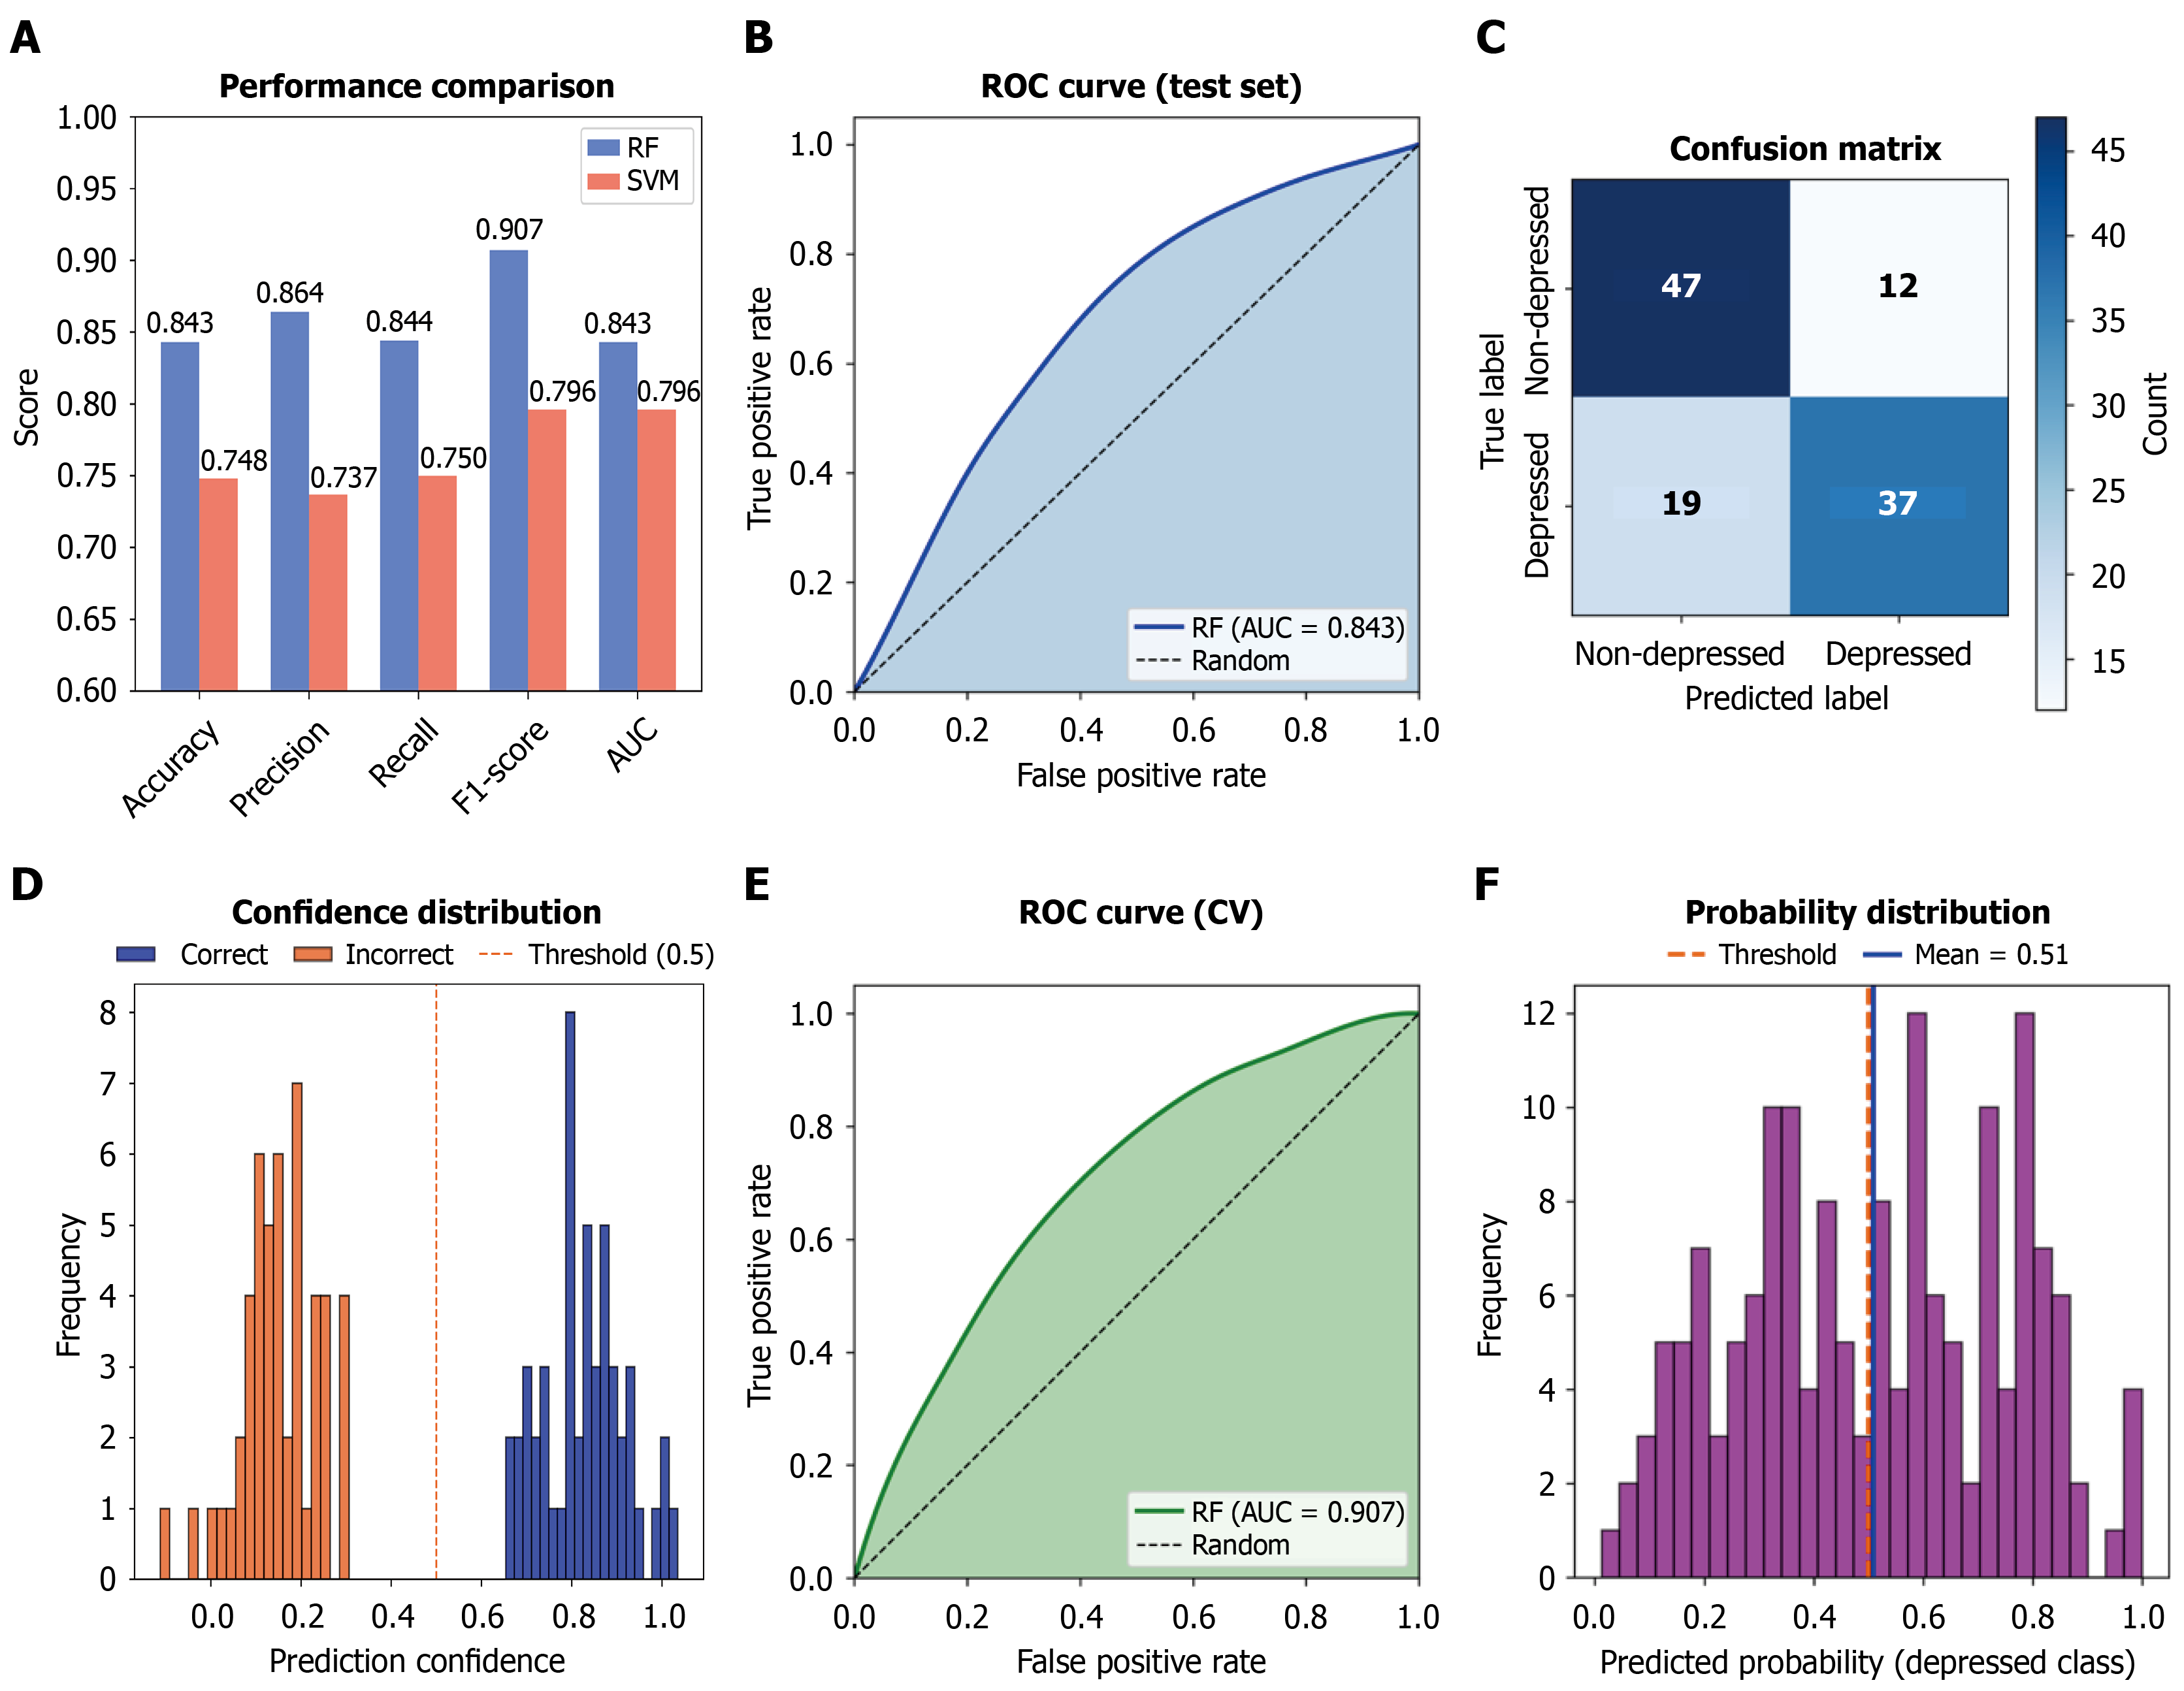
Figure 2 Performance evaluation of the random forest classifier.
A: Random forest (RF) improvements of +0.0695 accuracy, +0.1110 precision, +0.0439 F1, and +0.0557 area under the curve (AUC) relative to support vector machine; B: Receiver operating characteristic (ROC) for the RF on the test set (AUC = 0.813); the grey diagonal indicates chance level; C: Confusion matrix of the RF model on the test set (threshold = 0.5). True negatives = 47, false positives = 12, false negatives = 19, true positives = 37. The RF achieved an accuracy of 0.730, precision of 0.755, recall of 0.661, and F1-score of 0.705; D: Prediction confidence distribution of the RF model (test set). Confidence values range from 0.50 to 0.93, with a mean of 0.688 (indicated by the orange dashed line); E: ROC curve of the RF model on the independent hold-out set; F: Predicted-probability distribution (RF) for the Depressed class on the test set (non-depressed in blue, depressed in red). The red dashed line marks the 05-decision threshold; the overlap (approximately 0.35-0.60) explains most errors. ROC: Receiver operating characteristic; AUC: Area under the curve; RF: Random forest.
- Citation: Li QZ, Wang LYK, Wang MH, Li JY, Chen XX, Fang W, Wang ZX, Chen PD, Bai QS, Sun P, Fan XW, Zhong R, Shi H. Gamified video-based affective computing framework for adolescent depression screening. World J Psychiatry 2026; 16(9): 119308
- URL: https://www.wjgnet.com/2220-3206/full/v16/i9/119308.htm
- DOI: https://dx.doi.org/10.5498/wjp.119308