















Copyright: ©Author(s) 2026.
World J Psychiatry. Aug 19, 2026; 16(8): 122383
Published online Aug 19, 2026. doi: 10.5498/wjp.122383
Published online Aug 19, 2026. doi: 10.5498/wjp.122383
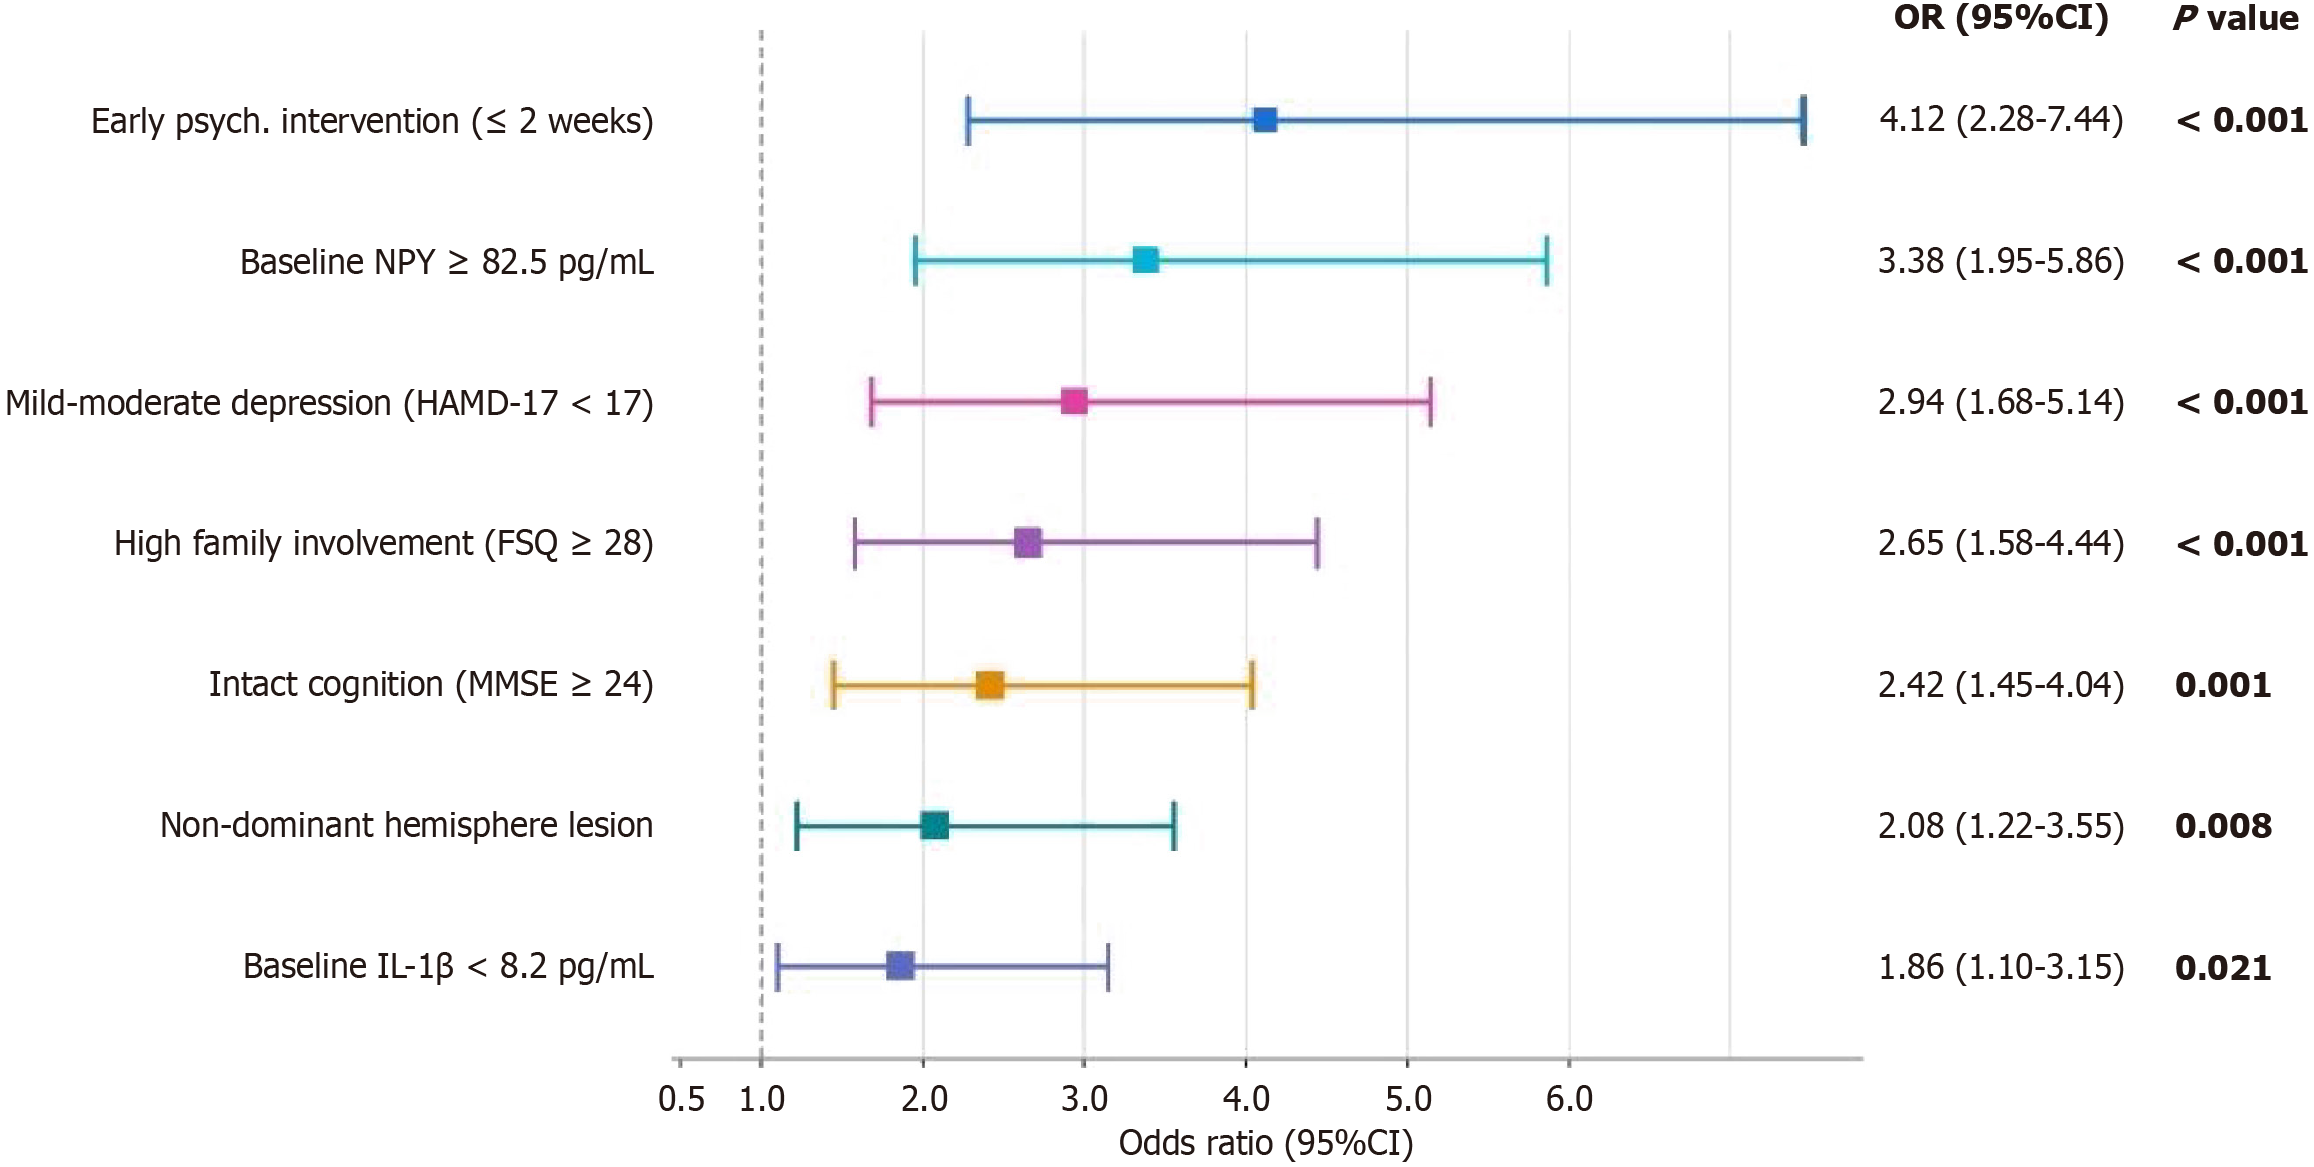
Figure 2 Forest plot displaying odds ratios and 95% confidence intervals for seven independent predictors of comprehensive rehabilitation treatment response from multivariable logistic regression analysis.
All confidence intervals lie entirely to the right of odds ratio = 1.0 (dashed reference line), confirming statistical significance. Colored squares represent point estimates; horizontal lines represent 95% confidence intervals. OR: Odds ratio; CI: Confidence interval; NPY: Neuropeptide Y; HAMD-17: Hamilton Depression Rating Scale-17; FSQ: Family support questionnaire; MMSE: Mini-Mental State Examination; IL: Interleukin.
- Citation: Yan SZ, Hu ZY, Zhou HY, Chai S. Comprehensive psychological and neurological rehabilitation for post-stroke depression: A retrospective comparative study with biomarker exploration. World J Psychiatry 2026; 16(8): 122383
- URL: https://www.wjgnet.com/2220-3206/full/v16/i8/122383.htm
- DOI: https://dx.doi.org/10.5498/wjp.122383