
















Copyright: ©Author(s) 2026.
World J Psychiatry. Aug 19, 2026; 16(8): 119686
Published online Aug 19, 2026. doi: 10.5498/wjp.119686
Published online Aug 19, 2026. doi: 10.5498/wjp.119686
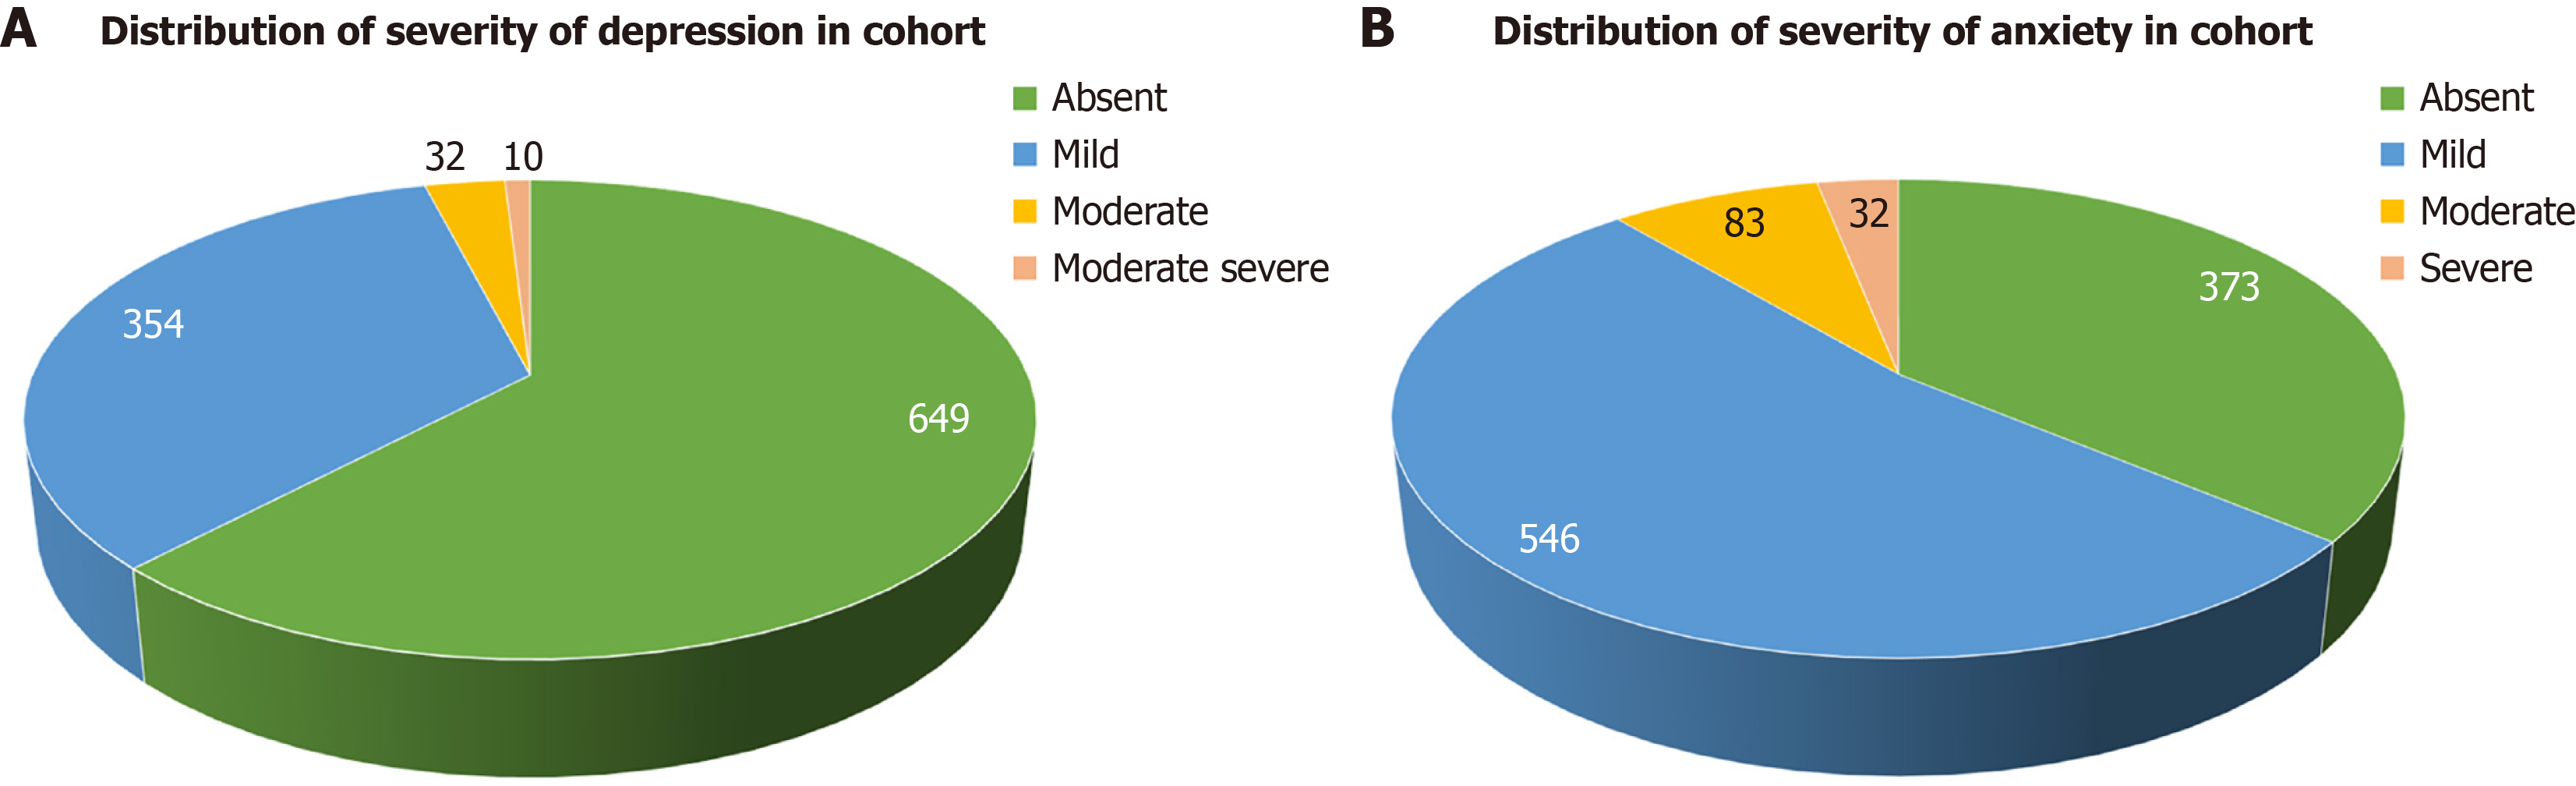
Figure 3 Distribution of depression severity and anxiety severity.
A: Distribution of depression severity in the study cohort. Pie chart illustrating the distribution of depression severity assessed using the Patient Health Questionnaire-9. Categories represent absent, mild, moderate, and moderately severe depression, based on the standard Patient Health Questionnaire-9 score thresholds. Values indicate the number of patients in each severity category; B: Distribution of anxiety severity in the study cohort. Pie chart illustrating the distribution of anxiety severity assessed using the Generalized Anxiety Disorder-7 scale. Categories represent absent, mild, moderate, and severe anxiety based on standard Generalized Anxiety Disorder-7 score thresholds. Values indicate the number of patients in each severity category.
- Citation: Goyal MK, Goyal O, Wander P, Kaur J, Prashar G, Goyal P, Sood A. Anxiety and depression in Rome IV disorders of gut–brain interaction: Prevalence, clinical impact, and temporal association. World J Psychiatry 2026; 16(8): 119686
- URL: https://www.wjgnet.com/2220-3206/full/v16/i8/119686.htm
- DOI: https://dx.doi.org/10.5498/wjp.119686