
















Copyright: ©Author(s) 2026.
World J Psychiatry. Jul 19, 2026; 16(7): 117921
Published online Jul 19, 2026. doi: 10.5498/wjp.117921
Published online Jul 19, 2026. doi: 10.5498/wjp.117921
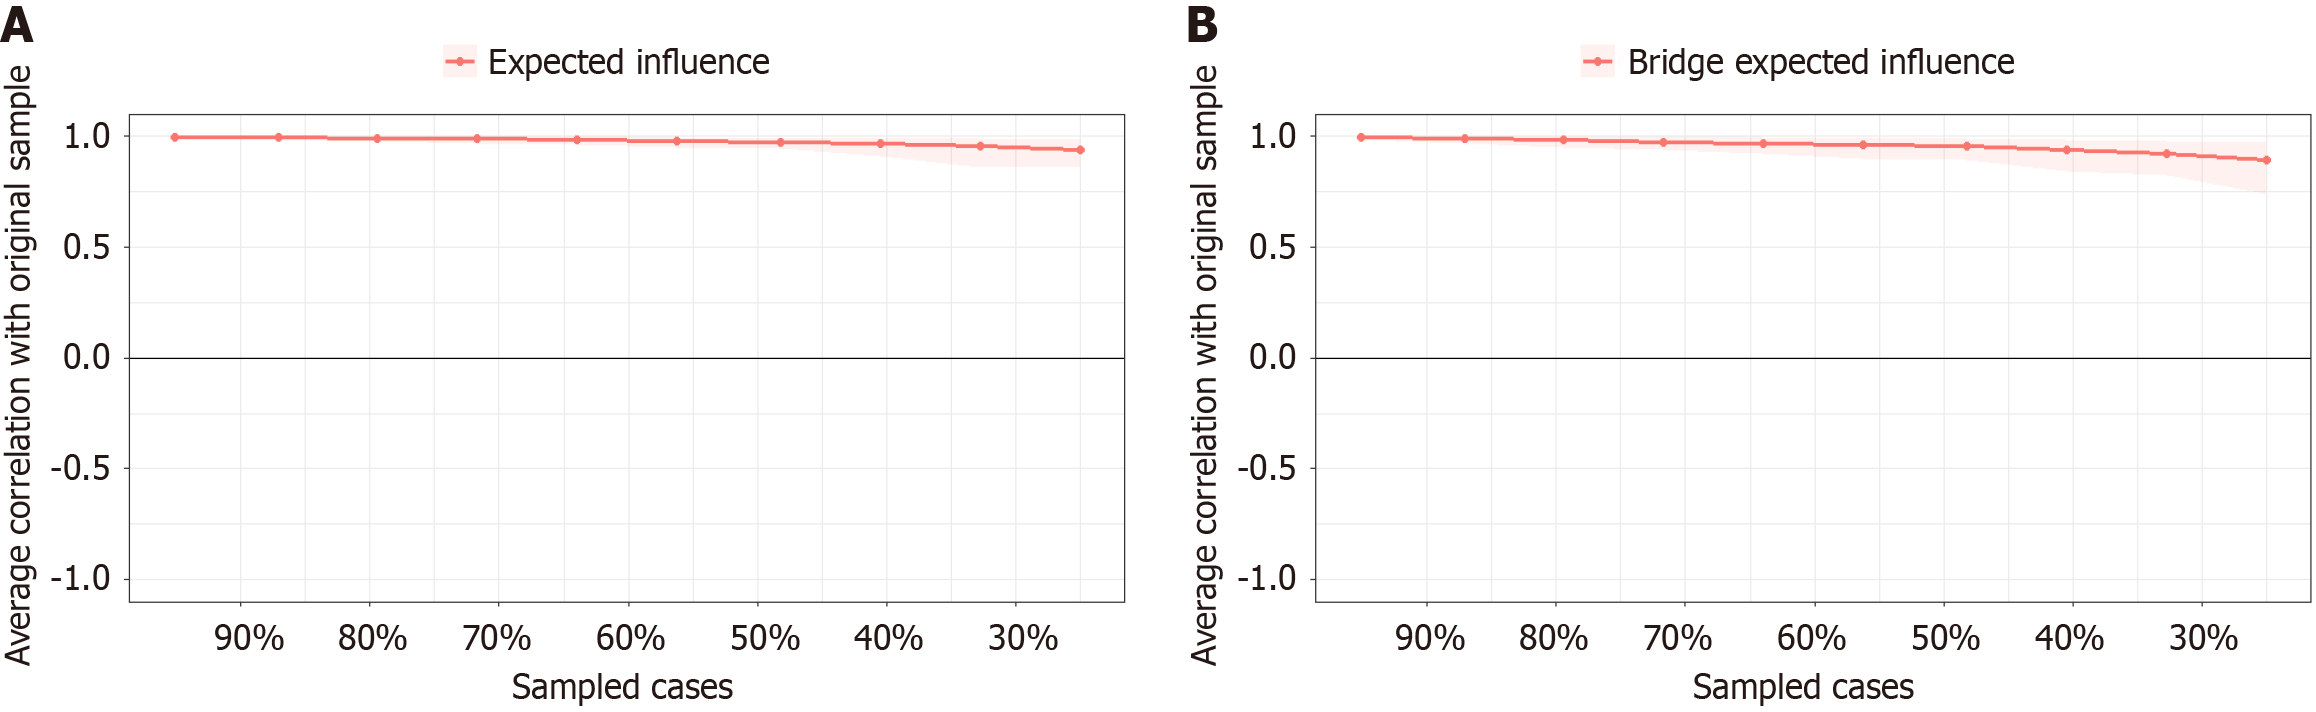
Figure 3 Stability of the expected influence and bridge expected influence values.
A: The red bar indicates the average correlation between the expected influence values across bootstrap samples, reflecting the stability of the centrality estimates. Higher values suggest more reliable and stable measurements of symptom influence in the network; B: The red bar indicates the average correlation between the bridge’s expected influence values across the bootstrap samples, reflecting the stability of the centrality estimates. Higher values suggest more reliable and stable measurements of symptom influence in the network.
- Citation: Zhang FF, Ma MF, Zhou LN, Gao R, Guo R, Yang W, Liang XL, Wang J. Network perspective on childhood trauma and non-suicidal self-injury behaviors and functions in adolescents with depressive disorders. World J Psychiatry 2026; 16(7): 117921
- URL: https://www.wjgnet.com/2220-3206/full/v16/i7/117921.htm
- DOI: https://dx.doi.org/10.5498/wjp.117921