
















Copyright: ©Author(s) 2026.
World J Psychiatry. Jul 19, 2026; 16(7): 117921
Published online Jul 19, 2026. doi: 10.5498/wjp.117921
Published online Jul 19, 2026. doi: 10.5498/wjp.117921
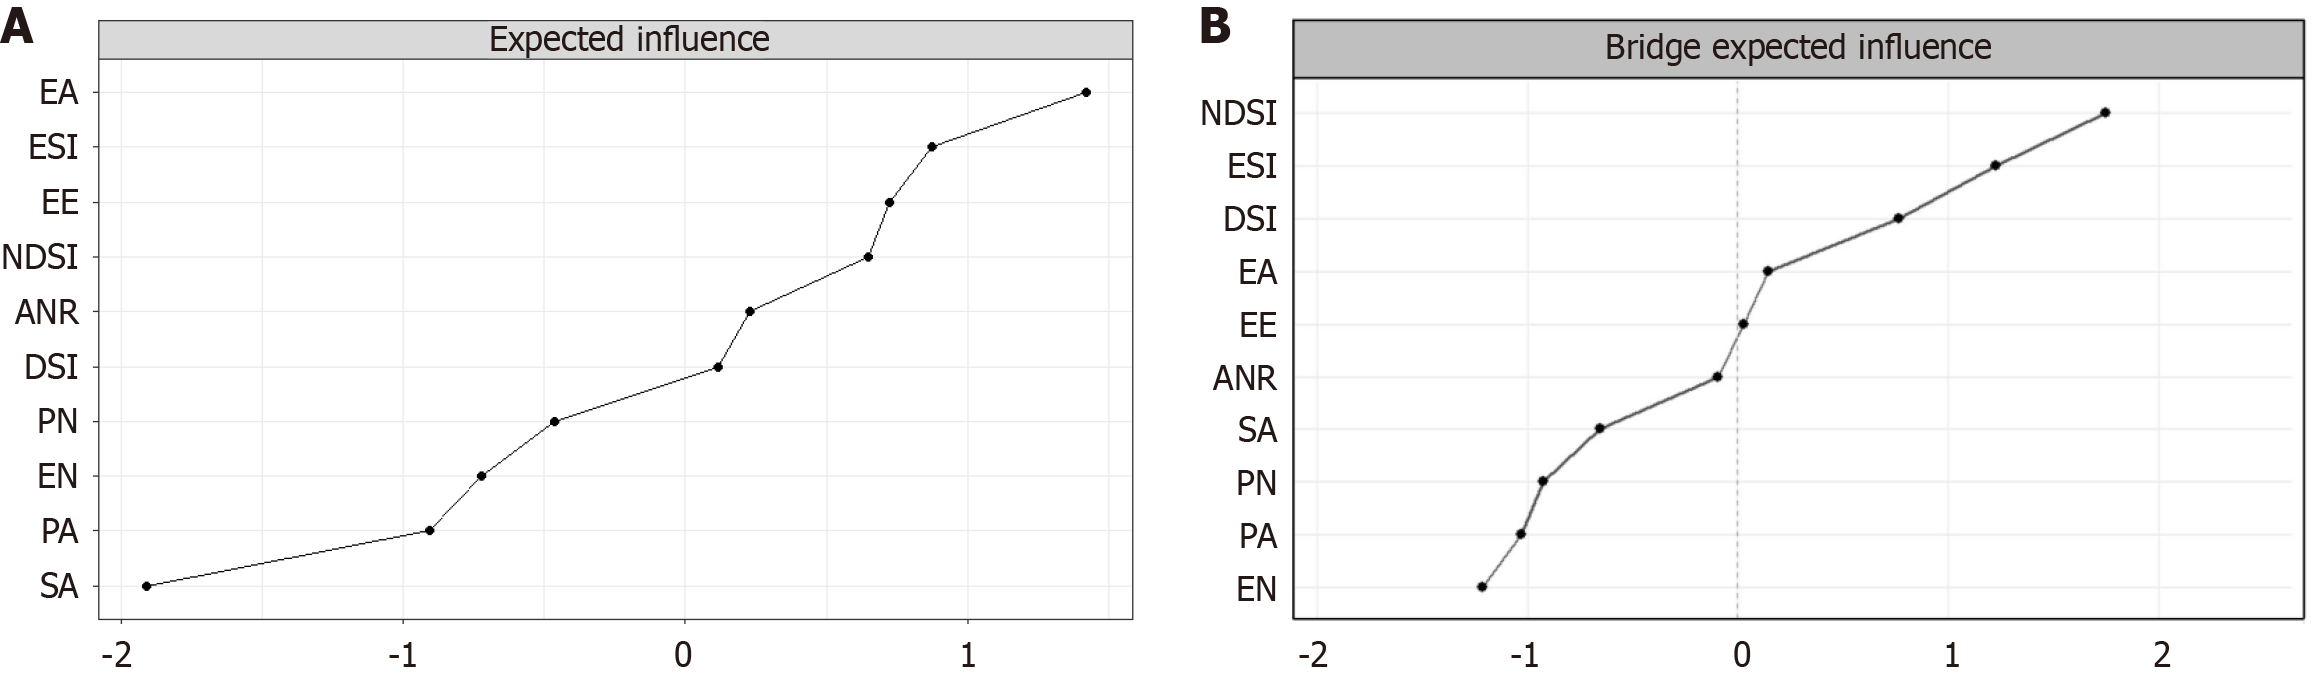
Figure 2 Standardized value (Z-score) of expected influence and bridge expected influence for each node in the network.
A: Each point represents a network node (childhood-trauma dimension, non-suicidal self-injury (NSSI) behavior, or NSSI functional motivation). The vertical axis shows the standardized expected influence (Z-score) of each node, indicating the strength of its connection to the other nodes in the network. Higher points correspond to more central nodes with a greater influence. The lines connecting the points are for visualization purposes only and do not imply causal relationships; B: Each point represents a network node (childhood-trauma dimension, NSSI behavior, or NSSI functional motivation). The vertical axis shows the standardized bridge expected influence (Z-score), indicating the strength of connection between the node and different symptom clusters (e.g., childhood trauma and NSSI behaviors/functions). Higher points indicate nodes that act as bridges between networks. The lines connecting the points are for visualization purposes only and do not imply causal relationships. EA: Emotional abuse; ESI: Egoistic social interaction; EE: Emotional expression; NDSI: Non-damaging self-injury; ANR: Automatic negative reinforcement; DSI: Damaging self-injury; PN: Physical neglect; EN: Emotional neglect; PA: Physical abuse; SA: Sexual abuse.
- Citation: Zhang FF, Ma MF, Zhou LN, Gao R, Guo R, Yang W, Liang XL, Wang J. Network perspective on childhood trauma and non-suicidal self-injury behaviors and functions in adolescents with depressive disorders. World J Psychiatry 2026; 16(7): 117921
- URL: https://www.wjgnet.com/2220-3206/full/v16/i7/117921.htm
- DOI: https://dx.doi.org/10.5498/wjp.117921