
















Copyright: ©Author(s) 2026.
World J Psychiatry. Jul 19, 2026; 16(7): 117803
Published online Jul 19, 2026. doi: 10.5498/wjp.117803
Published online Jul 19, 2026. doi: 10.5498/wjp.117803
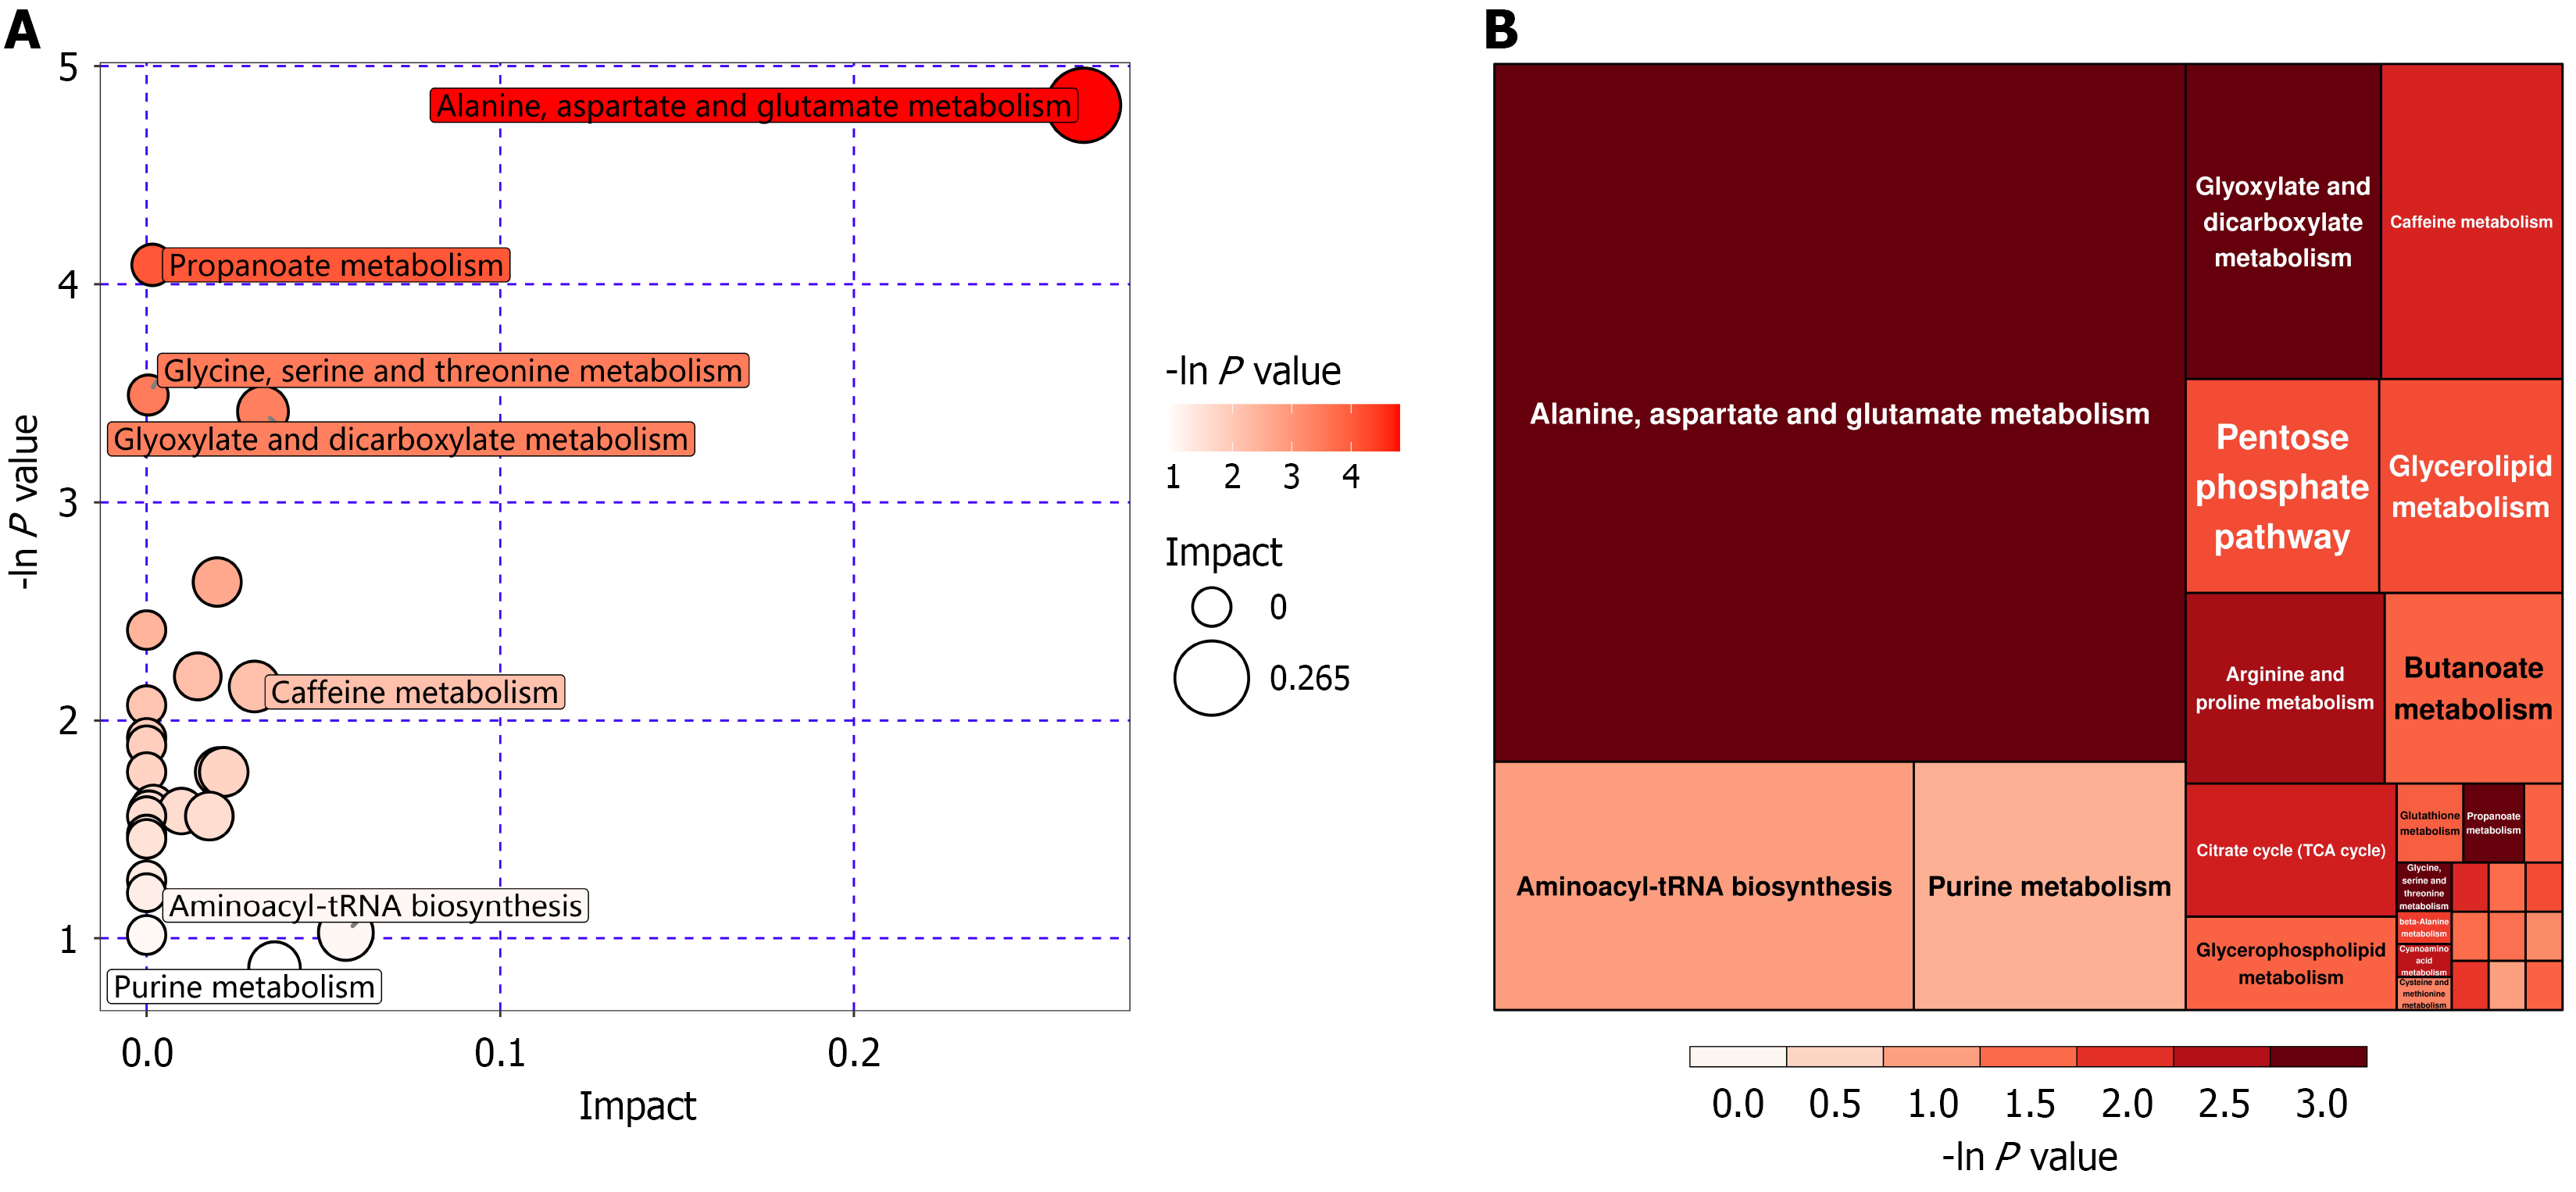
Figure 8 Bubble diagram for metabolic pathway analysis and rectangular treemap for metabolic pathway analysis.
A: Bubble diagram for metabolic pathway analysis. Each bubble in the bubble chart represents a metabolic pathway. The horizontal coordinates of the bubble and bubble size represent the influence factors of the pathway in topological analysis, the larger the bubble size, the larger the influence factor; the vertical coordinate of the bubble and bubble color represent the P value of the enrichment analysis [take the negative natural logarithm, i.e. -ln(P)]. The darker the bubble color, the smaller the P value and the more significant the enrichment degree; B: Rectangular treemap for metabolic pathway analysis. Each block in the figure represents a metabolic pathway. The size of the block indicates the influence factor of the pathway in topological analysis, the larger the block size, the larger the influence factor; the color of the block represents the P value of the enrichment analysis [take the negative natural logarithm, i.e. -ln(P)], the darker the block color, the smaller the P value, and the more significant the degree of enrichment.
- Citation: Zhang J, Li WB, Wang XX, Han TT, Dong S, Sang YN, Lu M, Guo XH. Congqi Shoushen Tuina Method for generalized anxiety disorder: Clinical outcomes and serum metabolomic profiles. World J Psychiatry 2026; 16(7): 117803
- URL: https://www.wjgnet.com/2220-3206/full/v16/i7/117803.htm
- DOI: https://dx.doi.org/10.5498/wjp.117803